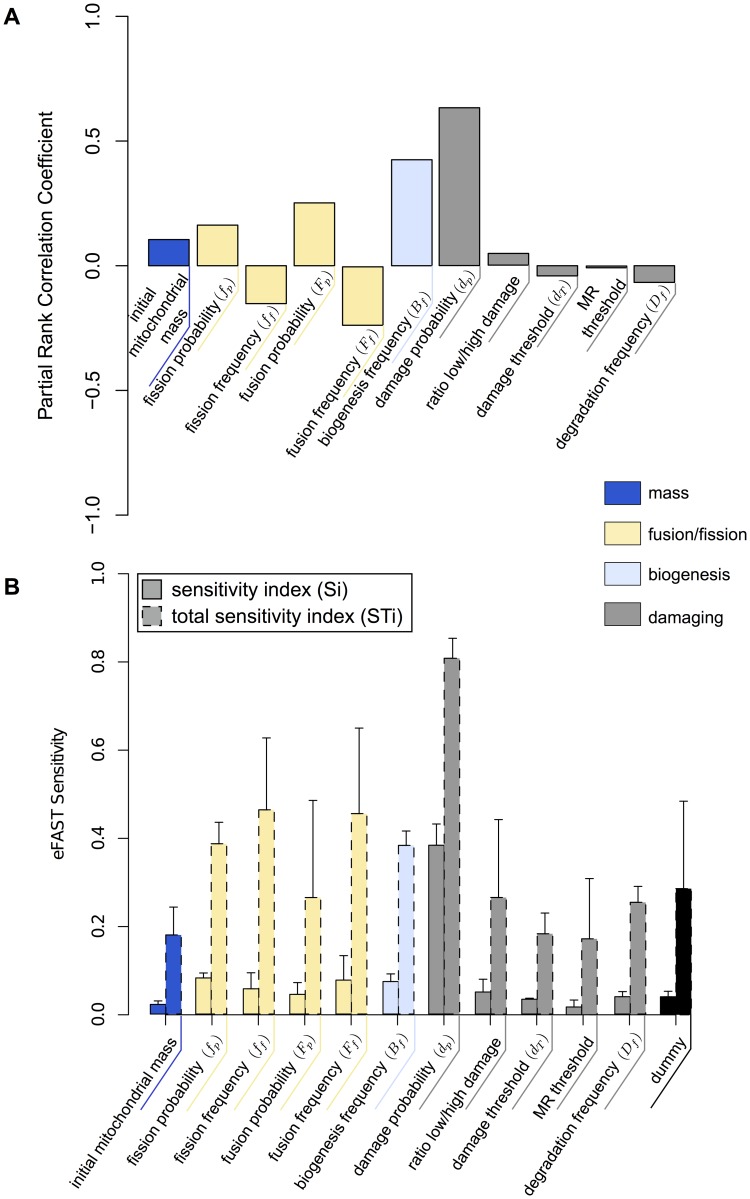
Fig 9. Sensitivity analysis of the full model.
(A) Effect of parameters perturbation on the full model. Bar graph represents Partial Rank Correlation Coefficient values for each parameter-output response pairing resulting from a Latin-hypercube sampling of 500 parameter value sets (parameter ranges are described in section “Energetic sensing, mitophagy and mitochondrial biogenesis are integrated processes”). For each parameter set the model was performed over 24 hours. (B) Results of the eFast method used to partition variance in simulation results between parameters. Solid Bars: sensitivity index (Si)–the fraction of output variance explained by the value assigned to that parameter when parameter of interest; Dashed Bars: total sensitivity index (STi)–the variance caused by higher-order non-linear effects between that parameter and the other explored (includes value of Si). Error bars are standard error over four resample curves. Parameter values sets were generated using the sinusoidal sampling approach. 65 parameters were obtained from each of the 4 resampling curves, producing 3120 parameter value sets (260 per parameter).

