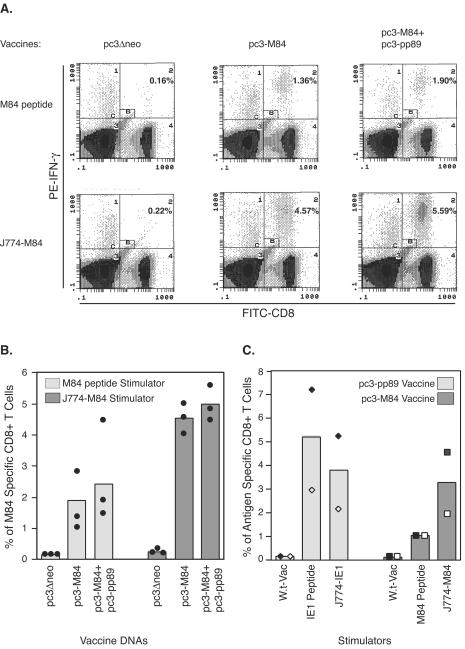
FIG. 1.
Detection of M84-specific CD8+ T cells with a J774 cell-mediated ICCS assay. (A and B) Three BALB/c mice per group were immunized i.d. three times with 10 μg of pc3Δneo, pc3-M84, or pc3-M84+pc3-pp89 at 10-day intervals. Ten days after the last immunization, splenocytes from individual mice were stimulated with 1 μM M84 epitope 297-305 peptide or J774 macrophage cells infected with an M84-expressing vaccinia virus at an MOI of 10 for 10 h. The resulting cells were processed for the ICCS as described in Materials and Methods. Fluorescein isothiocyanate-anti-CD8 and phycoerythrin-anti-IFN-γ antibodies were used to stain the cells. CD8+ T cells that had accumulated intracellular IFN-γ were detected and enumerated by flow cytometry. Panel A shows representative dot plots displaying IFN-γ-positive CD8+ T cells detected from various mouse groups by using either M84 peptide or M84-expressing J774 cells (J774-M84) as stimulators in the ICCS assay. The numbers in quadrant C2 represent the percentages of IFN-γ positive CD8+ T cells after exclusion of the nonspecific cells in gate B (small rectangle in quadrant C2). The symbols around the columns in panel B represent the percentages of IFN-γ-positive CD8+ T cells in individual mice. (C) Two mice per group were immunized i.d. three times with 10 μg of pc3-M84 or pc3-pp89 plasmids at 10-day intervals. Ten days after the last immunization, mouse splenocytes were incubated with the IE1 epitope 168-176 peptide, the M84 epitope 297-305 peptide, or J774 cells infected for 10 h with recombinant vaccinia virus expressing IE1 or M84 and then analyzed by ICCS assay. Percentages of antigen-specific CD8+ T cells from a mouse immunized with pc3-pp89 (⧫), from the other pc3-pp89-immunized mouse (◊), from a mouse immunized with pc3-M84 (▪), and for the other M84-immunized mouse (□) are shown.

