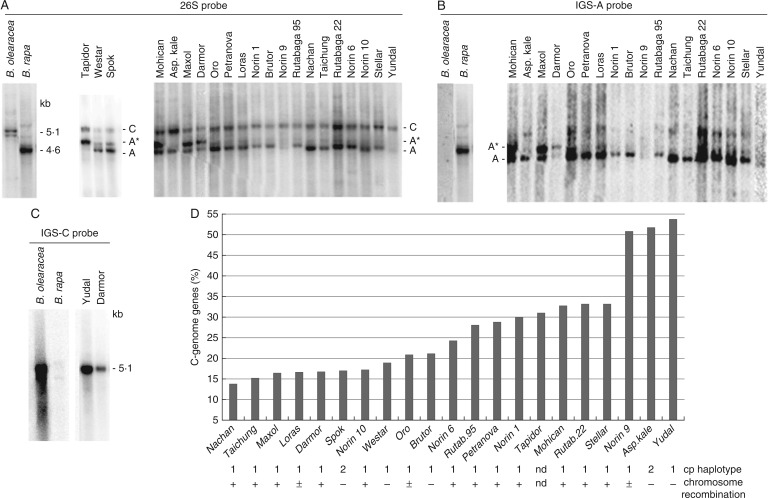
Fig. 1.
(A) Southern blot hybridization of genomic DNA from several B. napus cultivars. In the left panel the blot was hybridized with the 26S probe. After stripping the blot was rehybridized with the A-genome-specific IGS probe (B). ‘C’, C-genome bands; ‘A’, A-genome bands; ‘A*’ indicates an IGS family amplified in a subset of B. napus cultivars. (C) Example of a Southern hybridization of the C-genome-specific IGS probe. Note strong hybridization of the probe to ‘Yudal’ DNA. (D) The radioactivity of bands was quantified using a Phosphorimager and homeologue gene number expressed as a proportion of C-genome rDNA to total rDNA. Numbers below indicate two major chloroplast haplotypes identified by Cifuentes et al. (2010). In the same study, the B. napus cultivars were divided into groups with low (–), intermediate (±) and high (+) frequency of homeologue chromosome pairing in meiosis (symbols towards the bottom).

