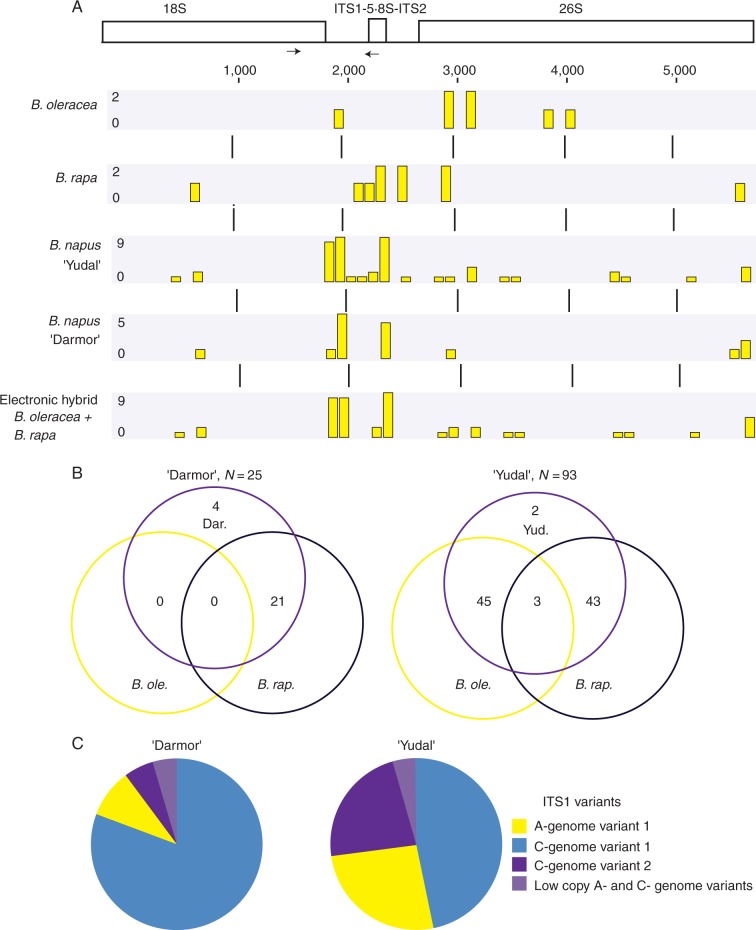
Fig. 2.
Intragenomic heterogeneity of rDNA units in progenitor species and two B. napus cultivars determined from whole genomic Illumina reads (A, B) and Roche 454 sequencing of ITS1 amplicons (C). The graphs in A reflect distribution of highly polymorphic sites (>20 % frequency) along the 18S–5·8S–26S region. Each column represents one or more high-frequency SNPs. Coalescence of more SNPs within the 10-bp window is reflected by column height. (B) Venn diagrams showing comparison of rDNA variants between B. napus and its progenitors. Note absence of B. oleracea variants in B. napus ‘Darmor’. (C) Circle chart diagrams showing the distribution of ITS1 variants in the genomes. The scheme of rDNA unit is depicted in A. Arrows indicate positions of primers used in amplicon sequencing and RT-CAPS analysis.

