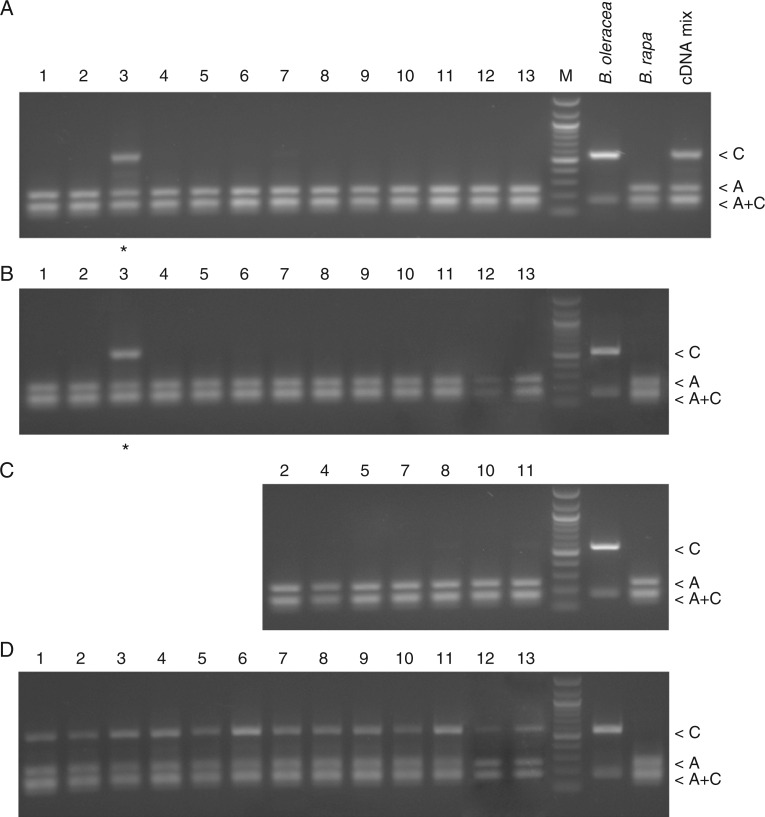
Fig. 4.
Expression analysis of 35S rDNA. The RT-PCR CAPS was performed using RNA extracted from B. oleracea (HDEM) and B. rapa (Z1) diploids and natural cultivars of B. napus: ‘Darmor’ (1), ‘Taichung’ (2), ‘Norin 9’ (3), ‘Petranova’ (4), ‘Spok’ (5), ‘Asparagus kale’ (6), ‘Norin 6’ (7), ‘Stellar’ (8), ‘Rutabaga’ (9), ‘Loras’ (10), ‘Yudal’ (11), ‘Westar’ (12) and ‘Tapidor’ (13). Gel restriction profiles of ITS1 amplification products obtained from leaf (A), root (B) and flower bud (C) cDNA. Control amplification products from mixed progenitor cDNAs are shown at the right in A. (D) Products from genomic DNA amplification. Asterisks indicate lanes where PCR products corresponding to both homeologues were amplified. The homeologue-specific bands were of ∼250 bp (‘A’, A-genome) and ∼550 bp (‘C’, C-genome) in size. A 100-bp DNA ladder was used as marker (M). The scale bar indicates the number of substitutions per nucleotide positions (5 base change per 100 nucleotide positions).

