Fig. 6.
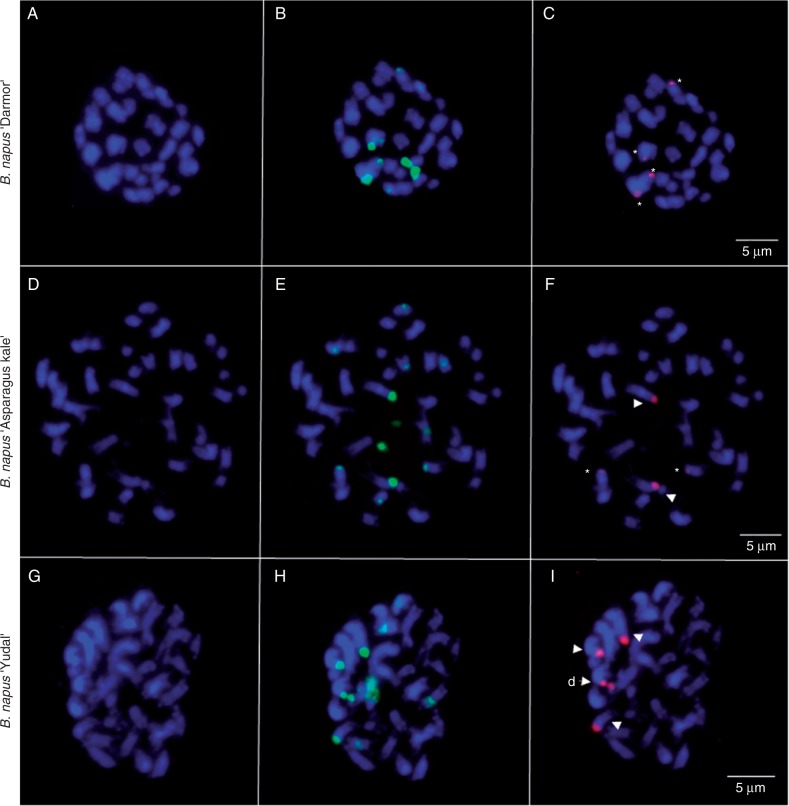
FISH was carried out using 35S rDNA (green) and IGS-C (red) probes. FISH analyses of somatic metaphase chromosomes of B. napus ‘Darmor’ (A–C), B. napus ‘Aparagus kale’ (D–F) and B. napus ‘Yudal’ (G–I). Minor and strong IGS-C signals are marked by asterisks and arrowheads, respectively. A partially decondensed NOR in ‘Yudal’ (I) is indicated by (d-▹). Chromosomes were counterstained with DAPI (blue). Scale bars = 5 μm.

