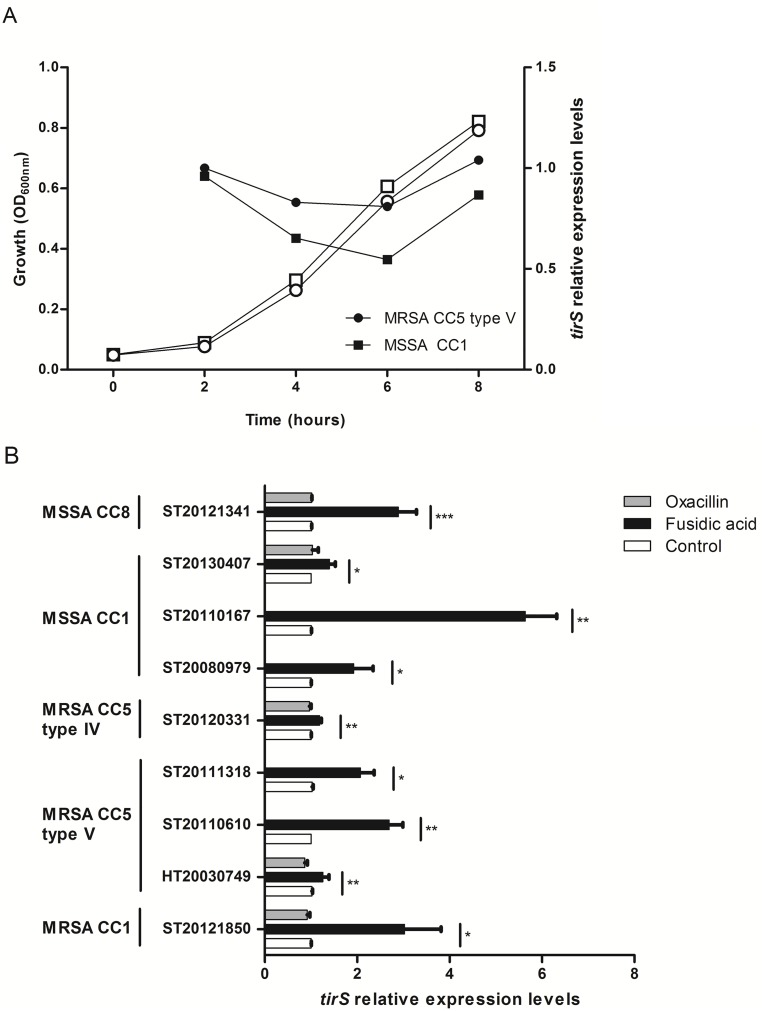
Fig 2. Impact of bacterial growth and antibiotic on tirS expression.
(A) The expression of tirS was quantified by RT-qPCR and normalized to the level of hu expression from total RNA extracts prepared from bacterial cultures at 2, 4, 6, and 8 h. MHB medium condition at 2 h was used as a reference. The figure shows an average of 2 independent experiments. White symbols represent bacterial growth, black symbols represent tirS expression. (B) Expression of tirS on 2-h bacterial cultures and 30 min of antibiotic treatment. Bacterial strains without stress were used as reference (relative quantity = 1) to estimate the relative quantity of tirS mRNA. White bars correspond to negative control (no antibiotic), grey bars to bacteria exposed to oxacillin, and black bars to bacteria exposed to fusidic acid. Data represent mean ± SEM of three to six independent assays. * p < 0.05; ** p < 0.01; *** p < 0.001.

