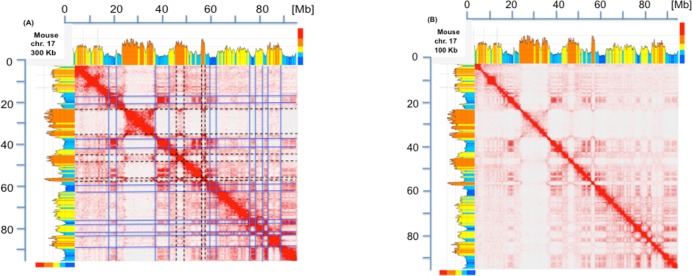
Fig 1. Heat map of chromatin interactions and isochores map of mouse chromosome 17.
(A). The heat map of chromatin interactions in mouse chromosome 17 (from [8]) is compared with the corresponding compositional profile (drawn from mm 10 genome assembly using a sliding window of 300 Kb and the program of [24]). Isochore families L1 to H3, characterized by increasing GC levels are defined according to the “fixed” boundaries between isochore families (see Table A in S1 File) and are represented in different colors, deep blue, light blue, yellow, orange and red, respectively; the multicolored vertical bars on the top right indicate GC levels that correspond to the compositional boundaries among isochore families. The self-interactions along the diagonal, as well as the interactions along the two major axes, correspond to short isochore blocks or to individual isochores, as stressed by lines through the coinciding boundaries of TADs (blue and broken black lines correspond to GC-poor and GC-rich isochores or isochore blocks, respectively; not all lines were drawn to avoid readability problems). Interactions corresponding to GC-poor regions are also seen in domains corresponding to other GC-poor regions even when located far away on the chromosomes, the intensity of such interactions decreasing, however, with distance. In the case of interactions corresponding to GC-rich isochores, much weaker signals are present outside the diagonal, an indication of more localized interactions. Note that mouse chromosome 17 is an acrocentric chromosome and that the centromeric sequences correspond to the region near the origin of the Megabase (Mb) scale. Unless otherwise stated, all the interaction maps presented in this article are shown at a 250 Kb resolution and isochores are visualized using a 300 Kb sliding window across chromosomes. (B) The heat map of mouse chromosome 17 is compared at a resolution of 100 Kb with the corresponding isochore profile. Interactions along the diagonal are weaker because split into smaller domains, that reveal fine details. For example, the largest GC-rich region on the chromosome (around 30 Mb) is now resolved into several domains that present a finer correspondence with isochores.

