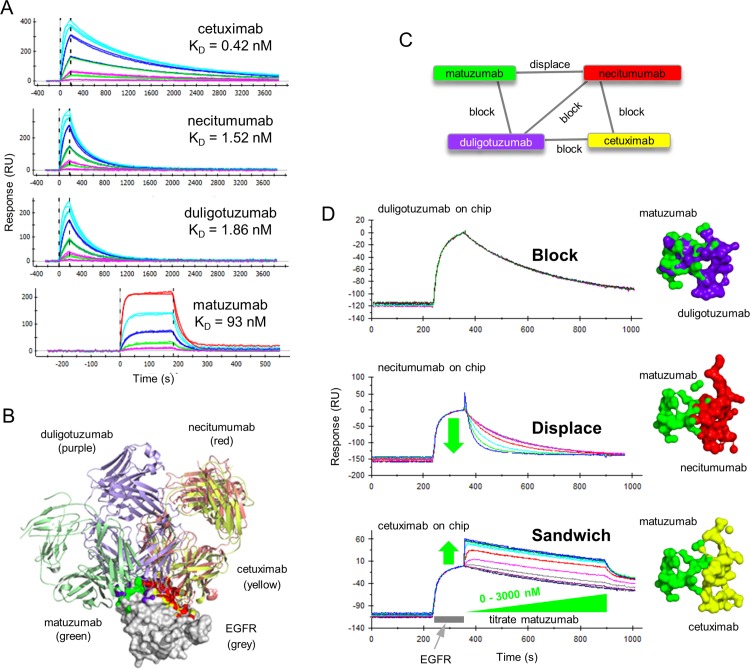
Fig 6. Kinetic and epitope characterization of four literature anti-EGFR mAbs.
(A) One-shot kinetic analysis of EGFR binding to amine-coupled mAbs. EGFR was injected over cetuximab, necitumumab, and duligotuzumab as both a 5fold and 3fold dilution series with top at 56 nM. EGFR was injected over matuzumab as a 3fold series with top at 278 nM. (B) Image of Fab:EGFR complexes when superposed via their EGFR domain III. EGFR domain III is shown in surface representation (white) while the different Fab fragments are shown in ribbon representation. Atoms that constitute the epitope for each Fab are colored in yellow (cetuximab), green (matuzumab), purple (duligotuzumab), and red (necitumumab). Buried surface areas were calculated as described under Materials and Methods. (C) Network blocking plot summarizing the empiric cross-blocking results. (D) Left panel—Waterfall competition plots obtained on a Biacore 2000 showing the empiric outcomes of block, displace, or sandwich, when matuzumab analyte is paired with duligotuzumab, necitumumab, or cetuximab ligands, respectively. Right panel—Surface representation of EGFR atoms that are buried upon complex formation for each of the mAbs.

