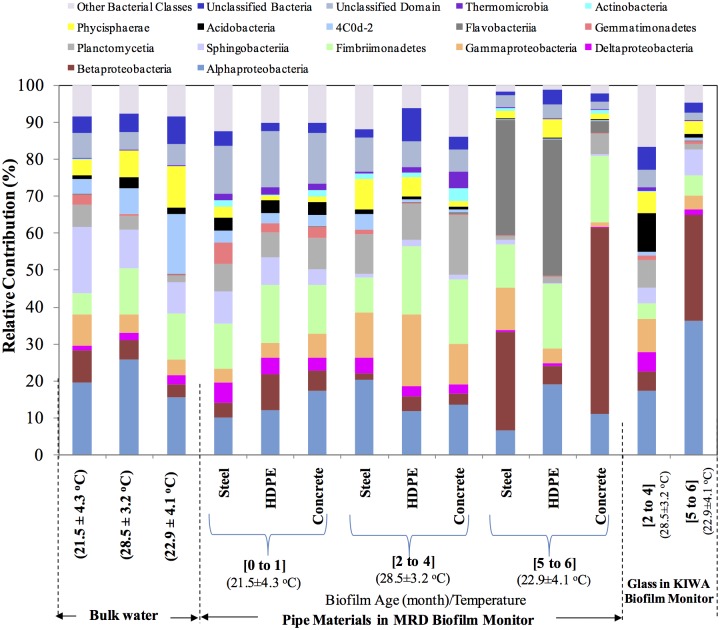
Fig 3. Comparison of the relative abundances of major bacterial classes found in biofilms on pipe materials and bulk water during three different sampling periods.
Bacterial classes denoted on figure legend represents an abundance >3% in any of the samples. The legend “Other bacterial classes” refer to a total representation of bacterial classes having an abundance <3% in any given sample.

