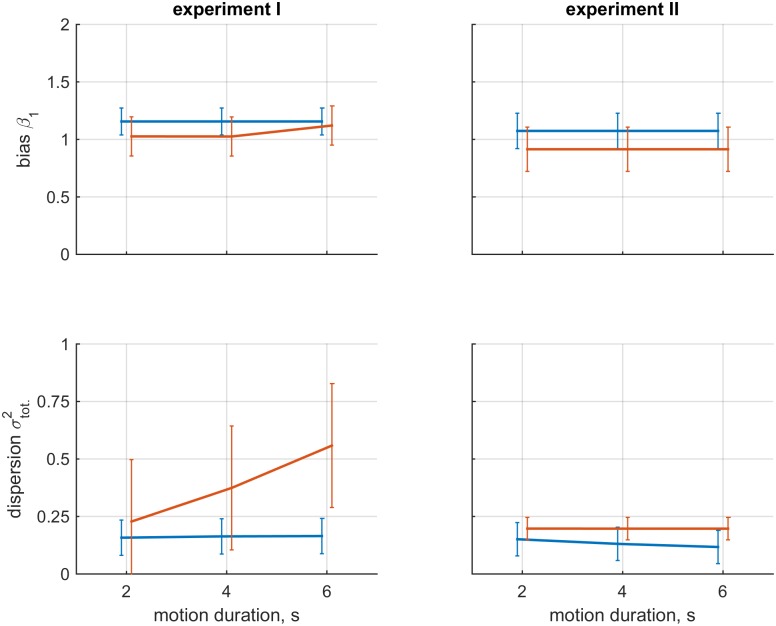
Fig 2. Visualization of findings on bias and dispersion aggregated over participants.
The left column shows the data for experiment I; the right column shows the data for experiment II. The upper row shows the mean and standard deviation of parameter β1 for the different motion conditions; the bottom row shows the total dispersion. Blue and orange lines represent the visual-only and inertial-only conditions, respectively. The errorbars represent standard deviation.

