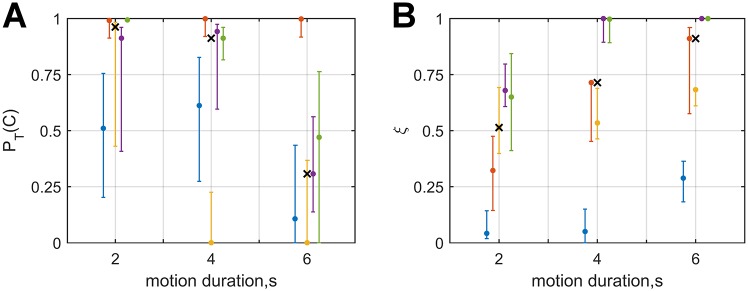
Fig 4. Estimates of the tolerance for discrepancies prior PT(C) (left panel) and reliance on the visual estimate ξT (right panel) for participants of both experiments for whom there was evidence that the parameters varied with motion duration, plotted against motion duration.
Data points in blue, orange, yellow, purple, and green correspond to experiment-participant I3, I7, I8, II4, and II5, respectively. Errorbars represent the parameters’ 95% confidence intervals, and the x-markers represent the median estimate for each PT(C) and ξT.

