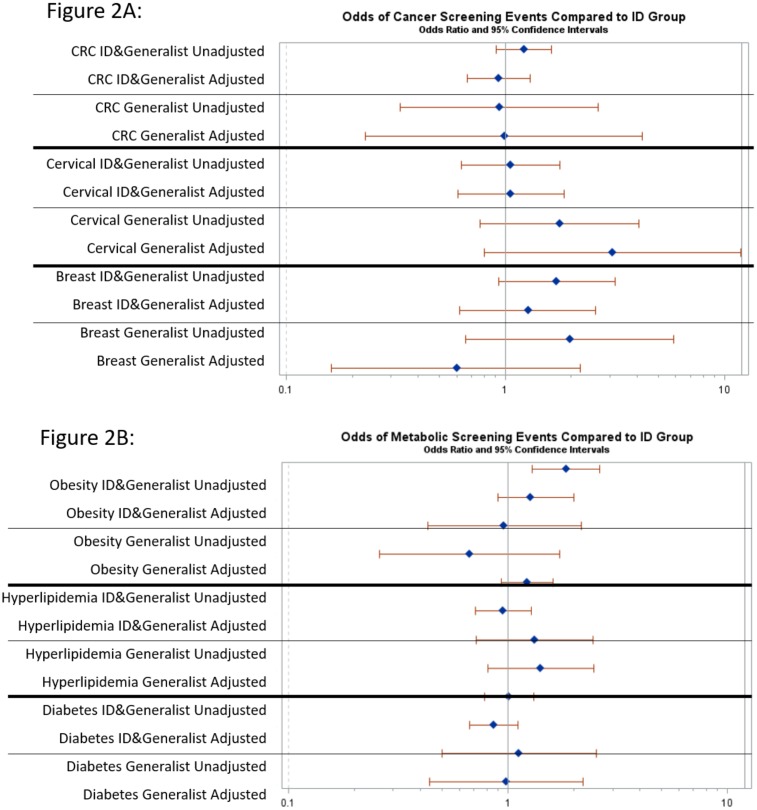
Fig 2. Odds of non-communicable disease screening events comparing ID plus generalist and generalist groups to ID group.
Panel A shows odds of metabolic/CVD screening. Panel B shows odds of cancer screening rates. Odds ratios and 95% confidence intervals are shown for unadjusted and adjusted analyses.

