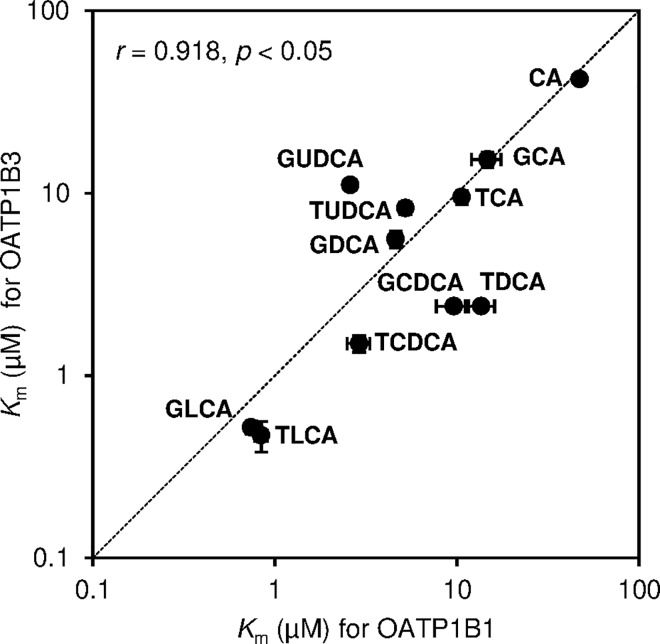
Fig 5. Correlation in Km values of bile acids for organic anion-transporting polypeptide (OATP) 1B1 and OATP1B3.
Km values of bile acids for OATP1B1 are shown on the X-axis and those for OATP1B3 are shown on the Y-axis. Dotted line in the graph represents 1:1 correlation. Each point represents the mean±S.E. (n = 3).

