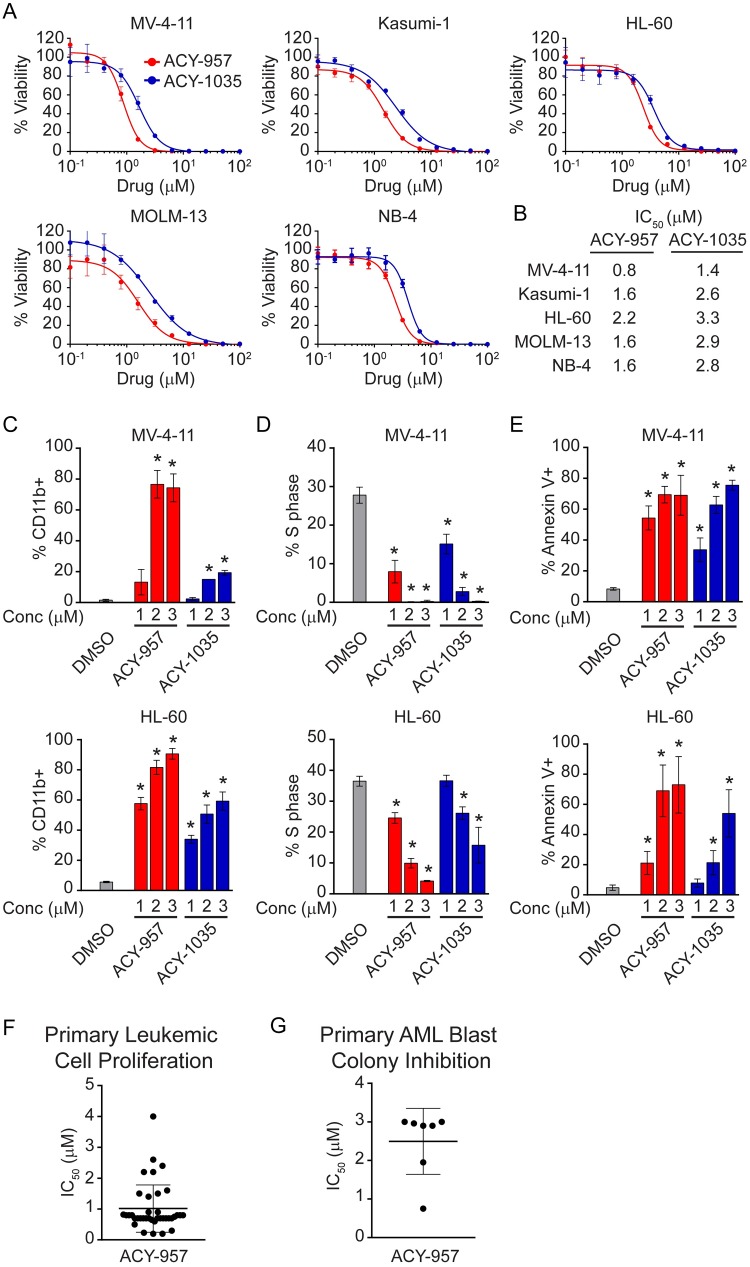
Fig 2. HDAC1/2 inhibition suppresses AML cells in vitro and primary AML blasts ex vivo.
(A) MV-4-11, Kasumi-1, HL-60, MOLM-13 and NB-4 cells were treated with increasing doses of ACY-957 or ACY-1035. After 72 hours, cell viability was measured and response curves plotted using GraphPad Prism 6. Mean ± SD, n ≥ 3. (B) IC50 values from curves in ‘A’ were calculated and listed. ACY-957 and ACY-1035 reduced viability of AML cells with an average IC50 value of 1.5 μM for ACY-957 and 2.6 μM for ACY-1035, respectively. (C) MV-4-11 (upper panel) and HL-60 (lower panel) cells were treated with increasing doses of ACY-957 or ACY-1035 for 72 hours. Surface levels of CD11b were measured by flow cytometry and percentage of CD11b positive cells plotted. ACY-957 and ACY-1035 increased the percentage of CD11b positive cells in a dose-dependent manner. Mean ± SD, n = 3 independent experiments. (D) Cells were treated as above. Cell cycle was analyzed by flow cytometry Edu positive population corresponding to S phase cells were quantified and percentage of S phase cells plotted. ACY-957 and ACY-1035 reduced S phase cells in a dose-dependent manner. Mean ± SD, n = 3 independent experiments. (E) Cells were treated at the indicated doses of compounds for 96 hours. Annexin-V positive cells were analyzed by flow cytometry. ACY-957 and ACY-1035 induced apoptosis in a dose-dependent manner. Mean ± SD, n = 3 independent experiments. (F) Fresh primary AML patient samples were plated into 96-well plates containing ACY-957 at 8 doses and incubated at 37°C for 96 hours. Leukemic cells were identified by surface markers as described in the Materials and Methods and viable leukemic cells corresponding to annexin V negative populations quantified by flow cytometry. IC50 values were calculated using GraphPad Prism 6 and plotted. ACY-957 inhibited the proliferation of primary leukemic cells with a mean IC50 value of 1.1 μM. Bars represent mean ± SD, n = 38. (G) Frozen primary AML patient samples were cultured in methylcellulose-based medium containing cytokines and 6 concentrations of ACY-957 for 14 days as described in the Materials and Methods. Colonies were quantified and IC50 values plotted. ACY-957 inhibited colony growth at a mean IC50 value of 2.6 μM. Bars represent mean ± SD, n = 7. For all panels, statistical analysis was performed by two-tailed Student’s t-test. * indicates P < 0.05 when comparing compound-treated group to DMSO control.

