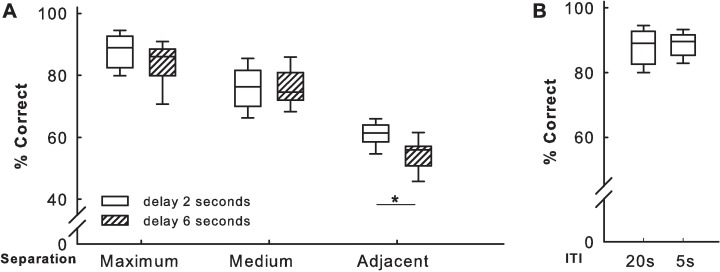
Fig 5. Performance during the automated TUNL probe test.
(A) Performance with two different time delays (2 or 6 s) and three spatial separation conditions (maximum, medium or adjacent). (B) Performance during maximum spatial separation and a 2 s delay with different ITIs (interference test). Boxplots show median, quartiles, and 10th/90th percentiles. n = 12 rats per condition. *p < 0.05

