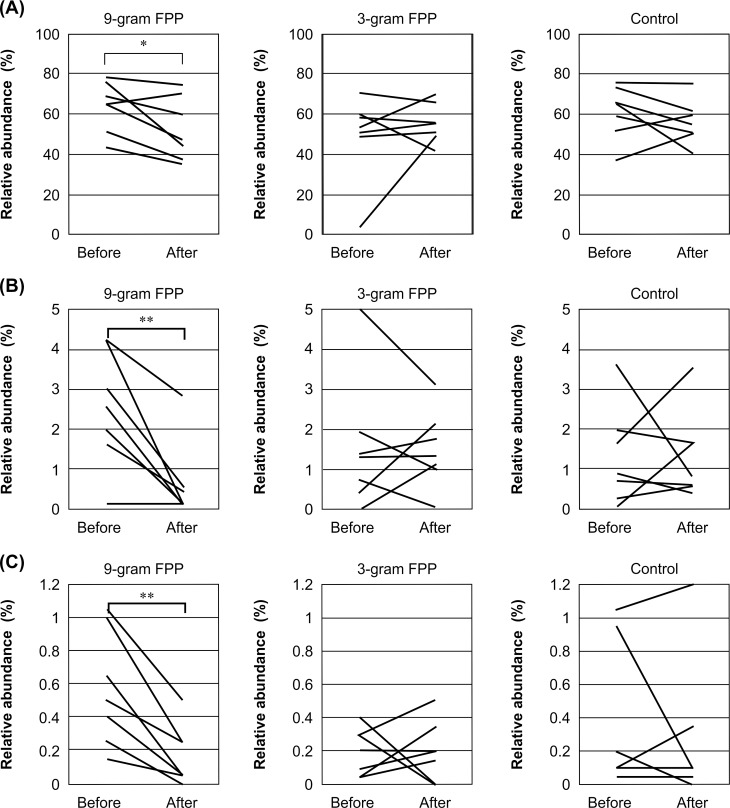
Fig 3.
Change in abundance of Firmicutes (A), OTU308 (C. scindens) (B), and OTU58 (E. lenta) (C). The relative abundance in each sample is plotted. Stool samples were collected before and after the administration of FPP and their bacterial compositions were analyzed by pyrotag sequencing of 16S rRNA genes. Data from the same subject are connected by a line. *P < 0.05 and **P < 0.01 (paired Student’s t-test)

