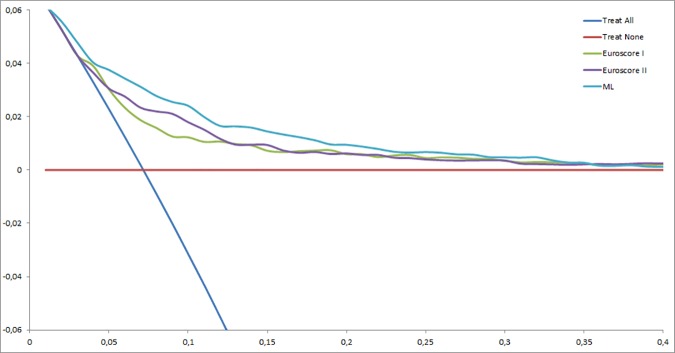
Fig 2. Decision curves showing the clinical usefulness of EuroSCORE I, EuroSCORE II, and the ML model in predicting post-operative mortality.
The blue line represents the net benefit of providing surgery for all patients, assuming that all patients would survive. The red line represents the net benefit of surgery to none patients, assuming that all would die after surgery. The green, purple and turquoise lines represent the net benefit of applying surgery to patients according to EuroSCORE I, EuroSCORE II, and ML model, respectively. The selected probability threshold (i.e., the degree of certitude of postoperative mortality over which the patient's decision is not to operate) is plotted on the abscissa.

