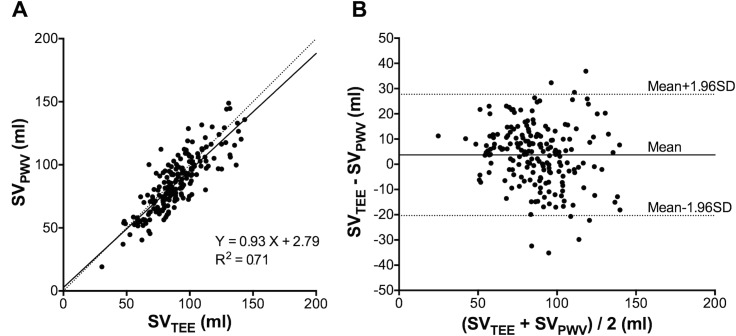
Fig 2. The relationship between SVPWV and SVTEE.
(A) The linear regression analysis illustrates the relationship between SV estimated from pulse wave velocity and SV measured by transesophageal echocardiography. The solid line indicates the regression, and the dashed line indicates the line of identity (x = y). (B) The Bland-Altman plots of the difference between SVPWV and SVTEE. The solid line indicates the mean of difference (3.70 ml), and the dashed line indicates the 95% limits of agreement (from -20.33 to 27.73 ml). SV: stroke volume, SVPWV: stroke volume estimated from PWV, SVTEE: stroke volume measured by transesophageal echocardiography.

