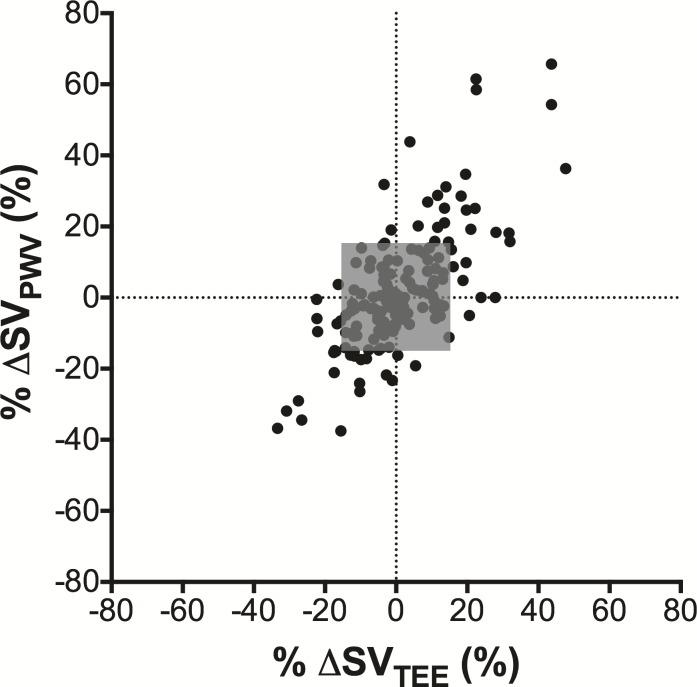
Fig 3. The four-quadrant plot analysis.
The four-quadrant plot analysis assesses the trending ability of %SV changes as estimated from pulse wave velocity compared to %SV changes as measured by transesophageal echocardiography. The concordance rate was 85.0% with an exclusion zone of 15% (shaded grey area). SV: stroke volume, %ΔSVPWV: rate of change in sequential stroke volume estimated from PWV, %ΔSVTEE: rate of change in sequential stroke volume measured by transesophageal echocardiography.

