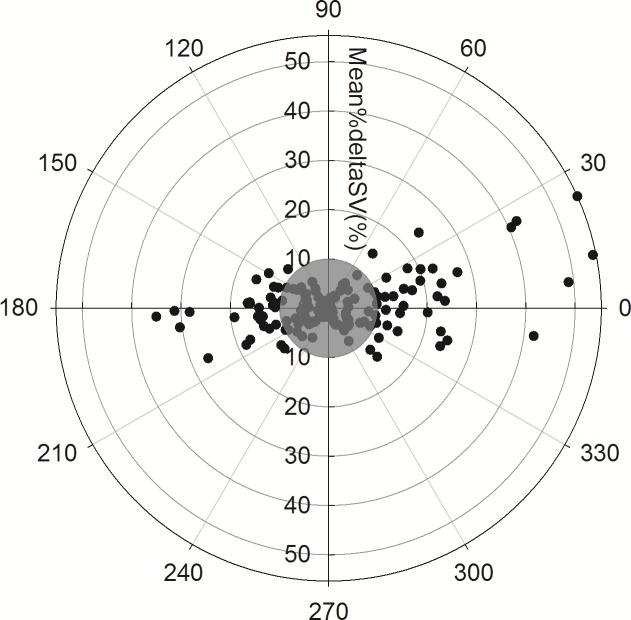
Fig 4. The polar plot analysis.
The polar plot analysis assesses the trending ability of %SV changes as estimated from pulse wave velocity compared to %SV changes as measured by transesophageal echocardiography. The mean angular bias was 1.38 degrees with radial limits of agreement of ±41.5 degrees. The concordance rate was 85.9% with an exclusion zone of 10% (shaded grey area). SV: stroke volume, Mean%deltaSV: the mean value of sequential SV change for the reference (%ΔSVTEE) and test (%ΔSVPWV) values. The coefficient of variability (CoV: SD of repeated measures as % of their mean) to assess inter-observer variability of SVPWV was 10.1%, which was within 15% of acceptable range.

