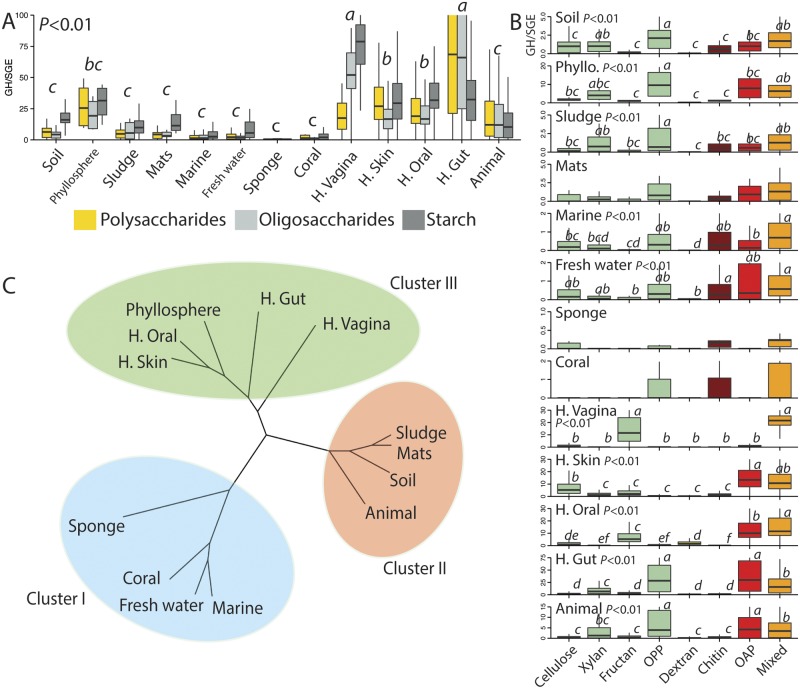
Fig 1. A and B, frequency, per sequenced genome equivalent (SGE), of sequences for GH across environments.
Polysaccharides are cellulose, xylan, fructan, other plant polysaccharides (OPP), chitin, dextran, other animal polysaccharides (OAP), and mixed substrates; Starch stands for both starch and glycogen. P-values are from the overall ANOVA on square-root transformed data (P>0.05, Tukey post-hoc test). C, environments clustering according to the frequency (median) of identified sequences for each GH families, across ecosystem-types.

