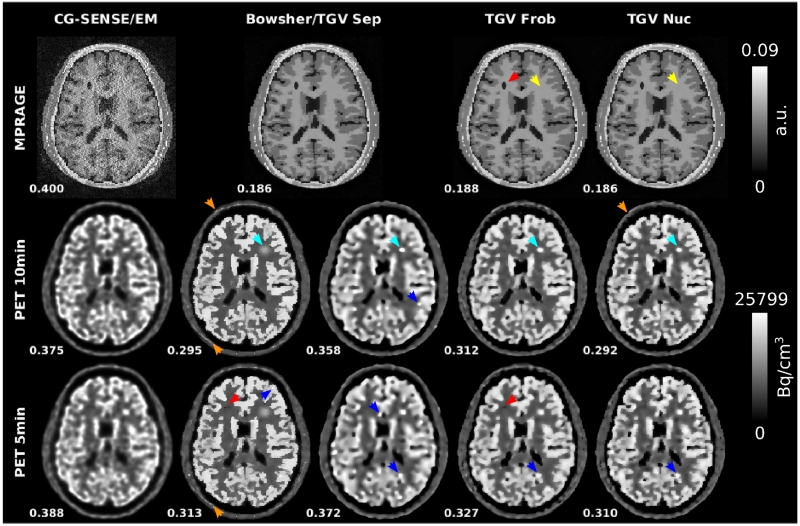
Fig. 3.
Reconstruction results from the numerical simulations of R=4 MPRAGE-MR acquisitions and two PET scan durations (10min and 5min). RMSEs to respective ground truths are displayed next to the reconstructed images. CG SENSE MR and PET EM reference reconstructions are shown together with separate, Frobenius and nuclear norm TGV and a Bowsherprior PET reconstruction using the separate TGV MR reconstruction as the MR prior. 10min PET data was used for the joint MR reconstructions shown here. RMSE values for MPRAGE jointly reconstructed with 5min PET are identical to those reconstructed jointly with 10min PET: 0.188 for Frobenius norm and 0.186 for nuclear norm. The strongest difference between the Bowsher prior and all TGV reconstructions can be observed in the area of the PET only lesion (cyan arrows, only added for 10min PET). For all Bowsher reconstructions, the unique PET lesion is heavily smoothed out and the signal intensity is decreased. In contrast, lesion sharpness and visibility is almost identical for the TGV reconstructions with and without MR coupling. Subtle sharp edges appear in the Bowsher and Frobenius norm 5min PET reconstruction in the area of the MR-only lesion (red arrows). Comparable artifacts appear in regions where no individual MR-lesions are present (some examples highlighted by blue arrows). In the skull region the nuclear norm shows no transfer of MR-specific features while small MR-only features start to appear in the Bowsher reconstruction (orange arrows). No transfer of edges or contrast of PET-only features occurs to MR (yellow arrows).

