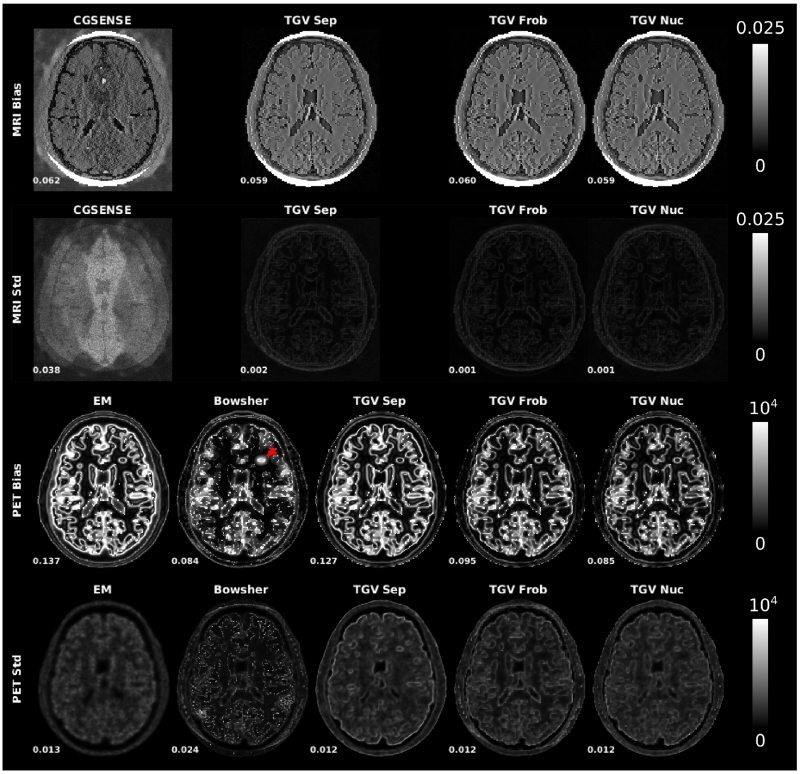
Fig. 7.
Bias and noise maps from the multiple replica experiment. R=4 MPRAGE and 5min PET datasets. The signal energy (squared sum of the map intensity value, normalized by the squared sum of the signal of the corresponding ground truth) is displayed next to each map. The Bowsher reconstruction shows a pronounced spot of high bias in the area of the unique PET lesion (indicated by red arrow).

