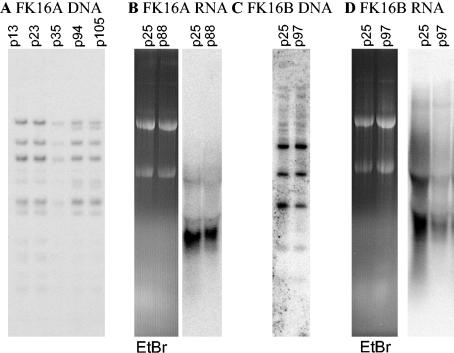
FIG. 4.
Patterns of viral DNA integration and RNA expression in immortalized cell lines at different passages. (A) Southern blot analysis of PstI-digested FK16A DNAs at passages 13, 23, 35, 94, and 105. (B) The right panel shows a Northern blot hybridization of FK16A RNAs at passages 25 and 88, demonstrating a slight decline in expression. The left panel shows ethidium bromide staining of the 18S and 28S rRNA as a loading control. (C) Southern blot analysis of PstI digestion of the FK16B cell line at passages 25 and 97. (D) The right panel shows a Northern blot hybridization of FK16B RNAs at passages 25 and 97, demonstrating a large decrease in viral RNA expression. The left panel shows ethidium bromide staining of the 18S and 28S rRNA as a loading control.

