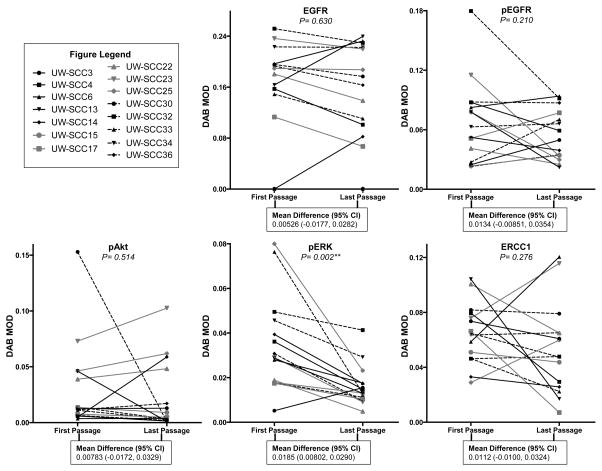
Figure 2. Comparing biomarker expression between the first and last passages of each PDX.
Depiction of the protein expression (DAB MOD value) of EGFR, pEGFR, pAkt, pERK and ERCC1 for the first and last passages of each PDX (DAB MOD: 3,3′-diaminobenzidine mean optical density). The mean difference and 95% confidence intervals (CI) are presented for the comparisons between the first and last passages of each PDX by biomarker (**P<0.01). Tissue data was used for all biomarkers except ERCC1, where the nuclear fraction was solely utilized (nuclear DAB MOD values).

