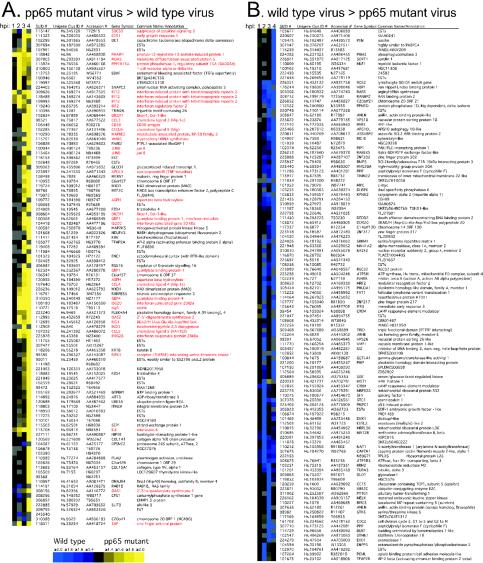
FIG. 1.
Cluster analysis (20) of genes regulated twofold or more in at least one time point (1, 2, 3, or 4 hpi) in a direct (type I) human cDNA microarray analysis comparing wt and pp65 mutant CMV. (A) Genes whose transcripts were more abundant upon infection with pp65 mutant RVAd65 than wt (pp65 mutant virus > wild-type virus). A total of 101 genes are represented in this panel. (B) Genes whose transcripts were more abundant upon infection with wt than pp65 mutant RVAd65 (wild-type virus > pp65 mutant virus). A total of 119 genes are represented in this panel. Each column of the microarray image represents a different time point, indicated at the top. Gray is used to indicate microarray spots that failed to pass the filtering criteria (see Materials and Methods). Red lettering denotes genes that are known to be IFN induced. Each row represents a different cDNA clone identified by a Stanford University identification number (SUID #). The Unigene cluster identification number (Clus ID #), GenBank accession number, gene symbol, and common gene name (or annotation) are also indicated for each clone. A color scale proportional to the factor of change is shown below panel A. Several cDNAs spotted in replicate on the microarrays (ISG20, 2 spots; dicer, 2 spots; MAX interacting protein 1, 2 spots; FZD-4, 2 spots; asparate β hydroxylase, 2 spots; GBP-1, 2 spots; JunB, 2 spots; C6orf37, 2 spots; and IFIT2, 3 spots) showed similar hybridization ratios. Complete data sets are available at http://genome-www5.stanford.edu.

