. 2016 Dec 23;5:e22963. doi: 10.7554/eLife.22963

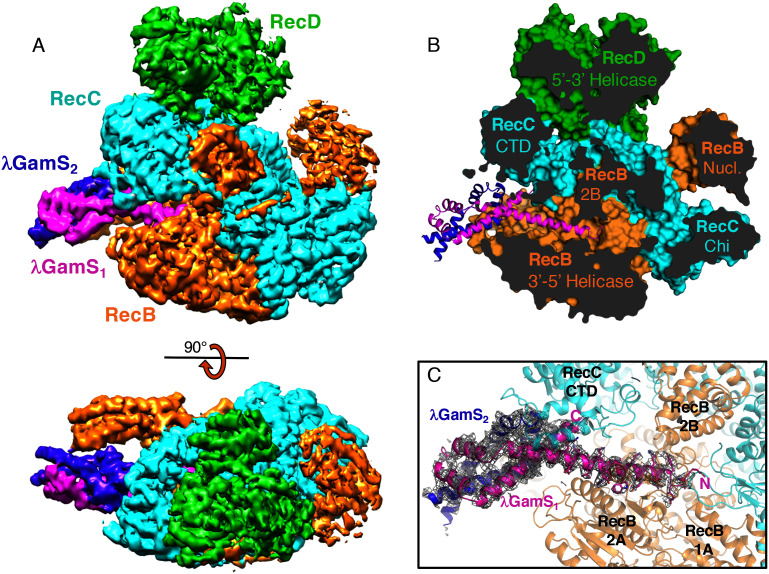
Figure 1. The overall structure of the RecBCD/Gam complex.

(A) Surface representation of the electron density with a ribbon representation of the RecBCD subunits and the GamS protein dimer. (B) Cut away of the molecular surface of the RecBCD part of the model with the GamS dimer overlaid showing how the protein enters and fills the channel normally occupied by the 3’ssDNA tail. (C) The same view with the electron density for the GamS dimer overlaid.

DOI: http://dx.doi.org/10.7554/eLife.22963.002

Figure 1—source data 1. EM data statistics and Final model.
DOI: 10.7554/eLife.22963.003

Figure 1.

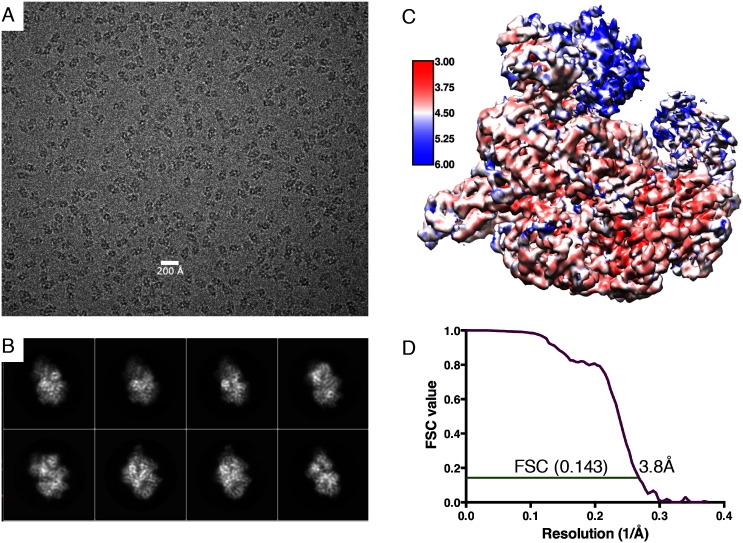
Figure 1—figure supplement 1. Electron microscopy information.

Figure 1—figure supplement 1.

(A) Typical micrograph of RecBCD/GamS complex particles. (B) A selection of 2D classes during refinement. (C) Local resolution map of the final reconstruction. (D) Gold standard FSC correlation curve.
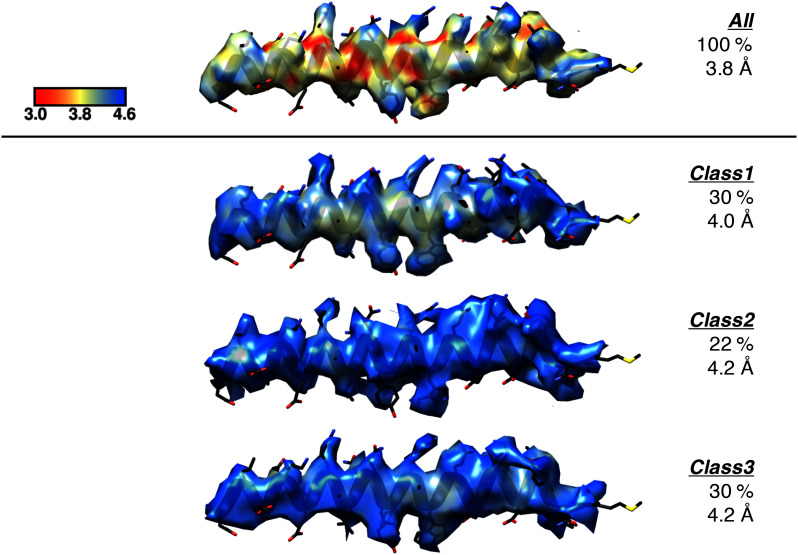
Figure 1—figure supplement 2. Representation of the local resolution of the GamS1 N-terminal helix for the deposited map compared to the same region in the maps of each of the three sub-classes.

Figure 1—figure supplement 2.

For each, only the extent of the map within 2.5 Å of the region of interest was displayed over the final refined coordinates (black), with all maps contoured to the same level in Chimera (0.04). ResMap was used to colour the surface of each map according to the local resolution as outlined by the scale bar. The three sub-classes were the major classes observed when the full dataset was re-classified using 3D classification without alignment as described in Materials and methods, with the resulting percentage distributions and final refined resolution limits indicated.