. 2017 Jan 6;6:e20070. doi: 10.7554/eLife.20070

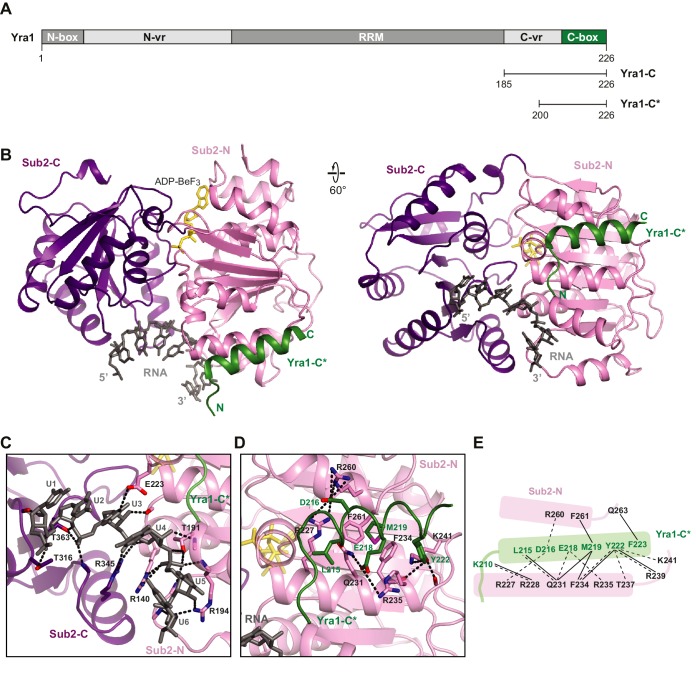
Figure 3. Crystal structure of the Sub2•Yra1-C*•RNA complex.

(A) Schematic representation of Yra1. Yra1-C and Yra1-C* were used for biochemical assays and crystallization studies, respectively. (B) Cartoon representation of the Sub2•Yra1-C*•RNA complex in two orientations. (C and D) Details of the Sub2-RNA and Sub2-Yra1 interactions, corresponding to the view in the right panel in B. The polar interaction network is indicated by black dashes. (E) Schematic representation of the Sub2-Yra1 interactions. Black dashes indicate polar interactions. Black lines indicate van der Waals interactions.

DOI: http://dx.doi.org/10.7554/eLife.20070.010

Figure 3.

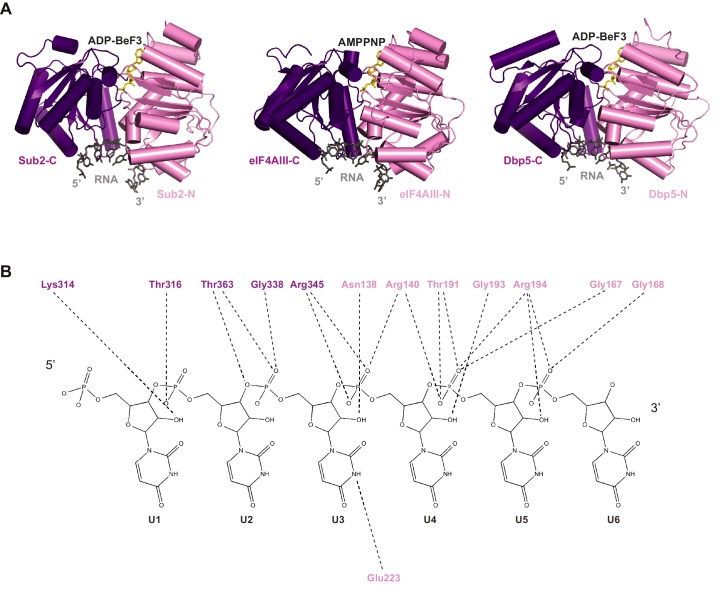
Figure 3—figure supplement 1. Comparison of RNA binding by DEAD-box proteins.

Figure 3—figure supplement 1.

(A) Alignment of Sub2•RNA with eIF4AIII•RNA (PDB 2 J0S) and Dbp5•RNA (PDB 3FHT) indicates a conserved mechanism of RNA recognition by DEAD-box proteins. (B) Schematic drawing of the polar interactions between Sub2 and RNA.
Figure 3—figure supplement 2. Multispecies sequence alignment of Yra1-C.

Figure 3—figure supplement 2.

Overall sequence conservation at each position is shaded from light gray (60% similarity) to black (100% identity). Numbering of the residues is according to yeast Yra1. The secondary structure as shown in Figure 3B is indicated above the sequence as rectangle (α-helix), line (coil region), and dots (disordered residues).