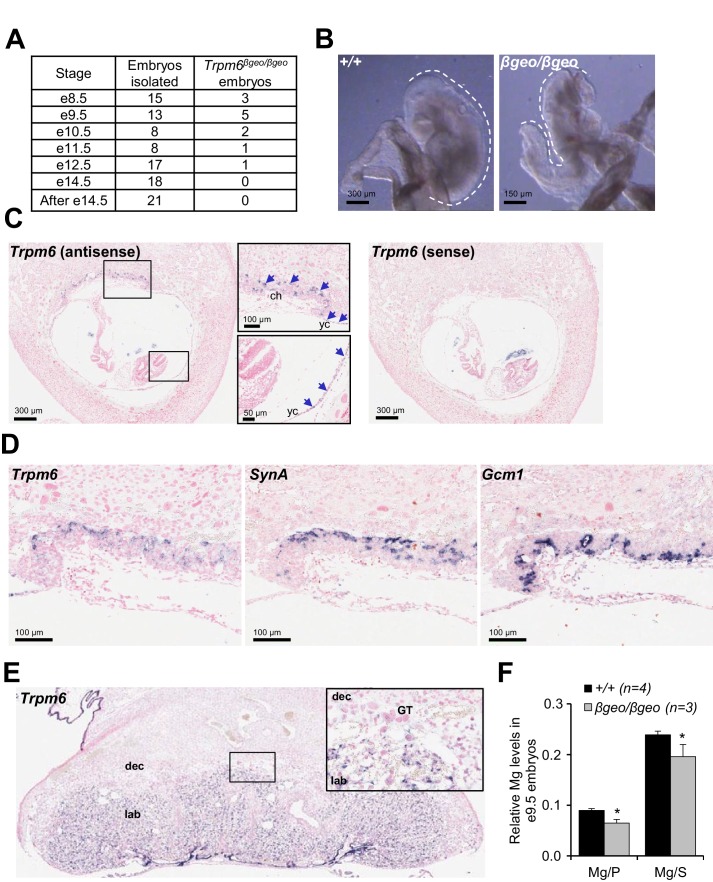
Figure 1. Assessment of Trpm6 function in extraembryonic tissues.
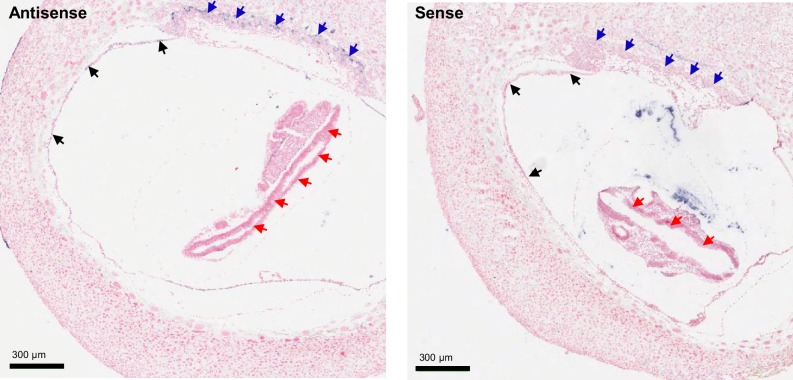
(A) Survival of Trpm6βgeo/βgeo embryos obtained from Trpm6βgeo/+ intercrosses. (B) Representative images of e9.5 Trpm6+/+ (+/+, n = 13) and Trpm6βgeo/βgeo (βgeo/βgeo, n = 5) embryos from dataset in (A). Dashed lines underline C-shaped versus S-shaped morphology of Trpm6+/+ and Trpm6βgeo/βgeo embryos, respectively. (C) ISH on serial paraffin sections obtained from wildtype n = 5 e8.5 fetus using antisense (left) and sense (right) probes for Trpm6. Boxes indicate the positions of the magnified images of the chorion (ch) and yolk sac (yc). Arrows indicate Trpm6-positive cells in the developing labyrinth (chorion) and the endoderm layer in the visceral yolk sac. (D) ISH on serial paraffin sections of wildtype e8.5 placenta using DIG-labelled probes for Trpm6 (left), SynA (middle) and Gcm1 (right), respectively. Note: Trpm6 expression was restricted to cells positive for SynA, a marker of SynT-I, and absent in cells expressing Gcm1, a marker of SynT-II. Representative images of n = 2 independent tissues are shown. (E) ISH of WT e14.5 placenta with the antisense Trpm6 probe. The box indicates the position of the magnified image. The Trpm6 signal is restricted to the labyrinth (lab) and not detectable in the decidua (dec) and trophoblast giant cells (GT). Representative images of n = 8 independent placentas are shown. (F) Mg2+ levels in e9.5 Trpm6+/+ (n = 4) and Trpm6βgeo/βgeo (n = 3) embryos. Distal segments of the embryos were used for genotyping, and the remaining parts were analysed by ICP-MS. Elementary magnesium (Mg) contents were normalized to phosphorus (P) and sulfur (S) levels represented as mean±SEM. *-p≤0.05 (Student’s t-test).


