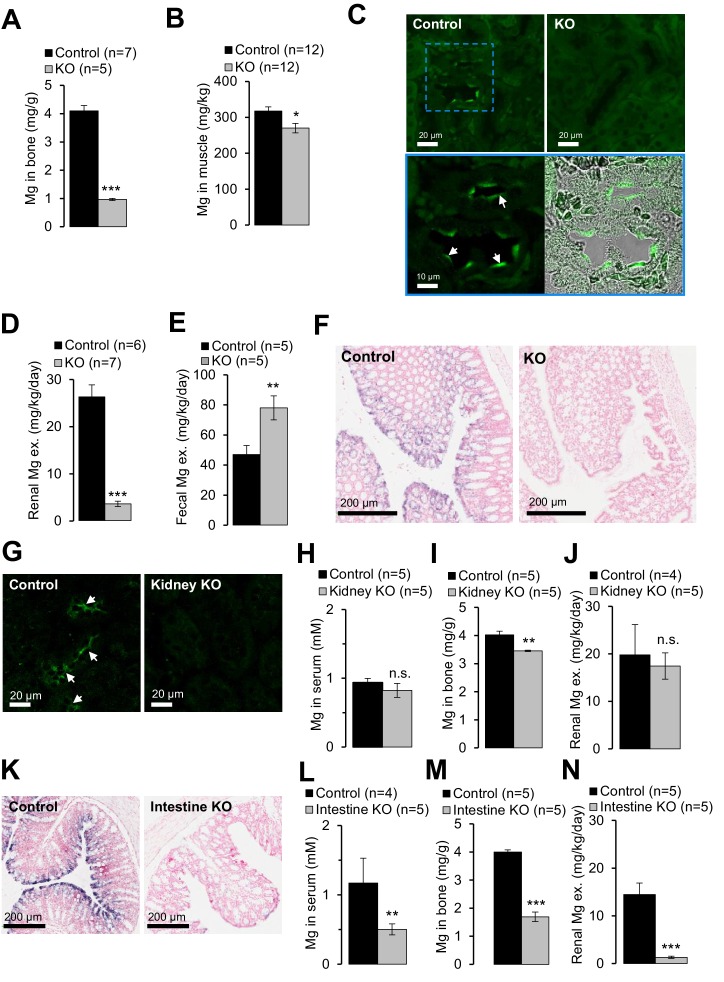
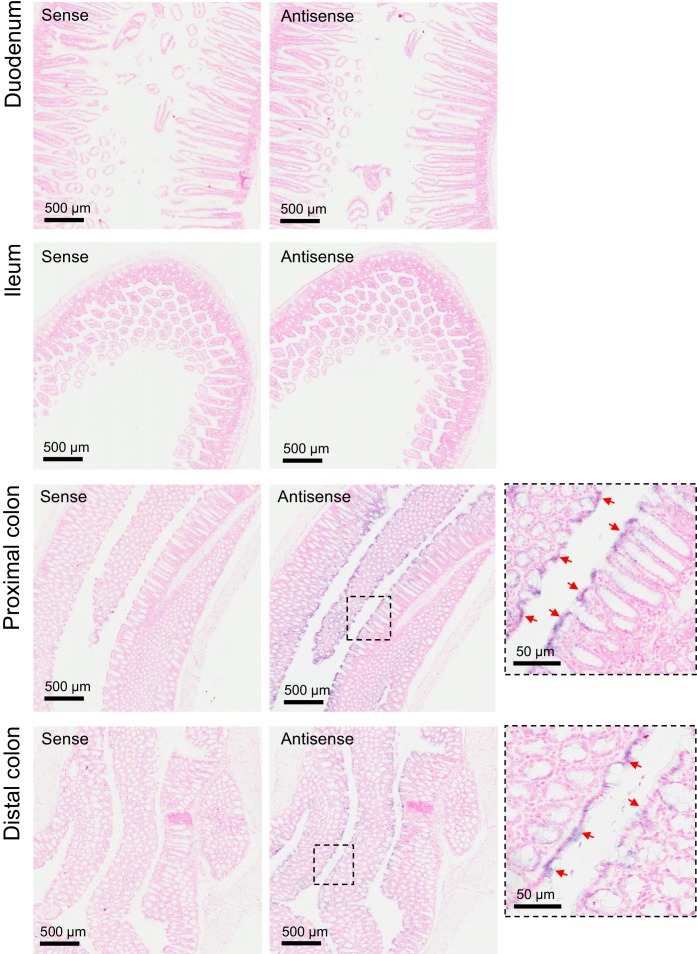
Figure 5. Examining of Mg2+ balance in Trpm6-deficient adult mice.
(A–F) Assessment of 8 week-old Trpm6fl/+ (Control) and Trpm6Δ17/Δ17;Sox2-Cre (KO) littermate males. (A) Mg2+ levels in bones and (B) gastrocnemius muscle assessed by ICP-MS. (C) Immunostaining of kidney cryosections using a TRPM6-specific antibody. Representative images are shown (n = 2 tissues per genotype). The blue square indicates the position of the confocal and differential interference contrast magnified images acquired from control tissue. Arrows indicate labelling of the apical surface of renal tubules. (D) 24 hr urinary and (E) fecal Mg2+ excretion rates. (F) ISH on paraffin sections obtained from the colon of control and Trpm6-deficient mice (n = 2 tissues per genotype). (G–J) Examination of 6 month-old Trpm6fl/+ (Control) and Trpm6Δ17/fl;Ksp-Cre (Kidney KO) littermate males. (G) Immunostaining of TRPM6 in kidney cryosections. Arrows indicate labelling of renal tubules. (H–I) Determination of Mg2+ in serum (H) and bones (I). (J) 24 hr urinary Mg2+ excretion rate. (K–N) Assessment of 6 month-old Trpm6fl/+ (Control) and Trpm6Δ17/fl;Villin1-Cre (Intestine KO) littermate males. (K) ISH on paraffin sections of the colon using a Trpm6-specific probe (n = 2 tissues per genotype). (L, M) Mg2+ levels in the serum (L) and bones (M). (N) 24 hr urinary Mg2+ excretion rate. Data are represented as mean±SEM. ***-p≤0.001; **-p≤0.01; *-p≤0.05; n.s. – not significantly different (Student’s t-test); n – number of mice examined. Histological analysis in (F) and (K) was performed with n = 3 animals per group resulting in similar observations.


