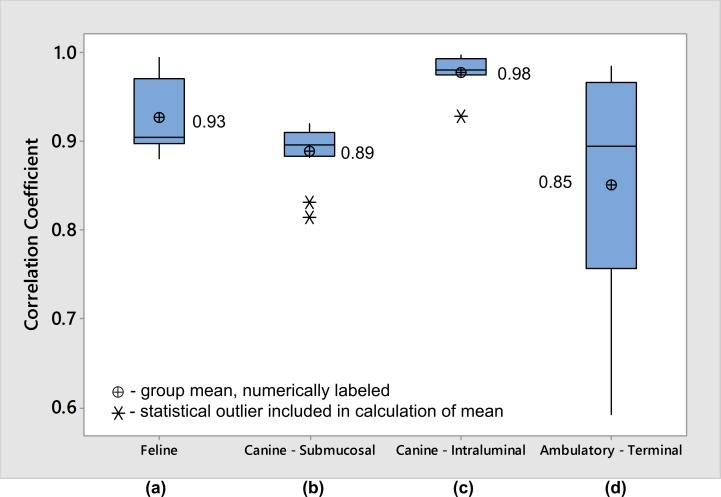
Fig 4. Pooled Multi-Contraction Correlation Coefficients from all animal experiments.
Boxplots of measured correlation coefficients between prototype device and reference catheter in (a) anesthetized feline with submucosal device placement, (b) anesthetized canine with submucosal device placement, (c) anesthetized canine with intraluminal device placement, and (d) anesthetized canine terminal procedure with intraluminal device placement after 10-day implant period. Each box represents correlation coefficients obtained from 9–16 ten second recording windows comparing prototype device and reference catheter measurements. The box width depicts the interquartile range of measured correlation coefficients, while the box whiskers represent the full range of measured data after excluding statistical outliers identified with Peirce’s criterion. The central line within each box represents the median, and the data mean is indicated with a cross symbol. Raw data is shown in S1 Table.

