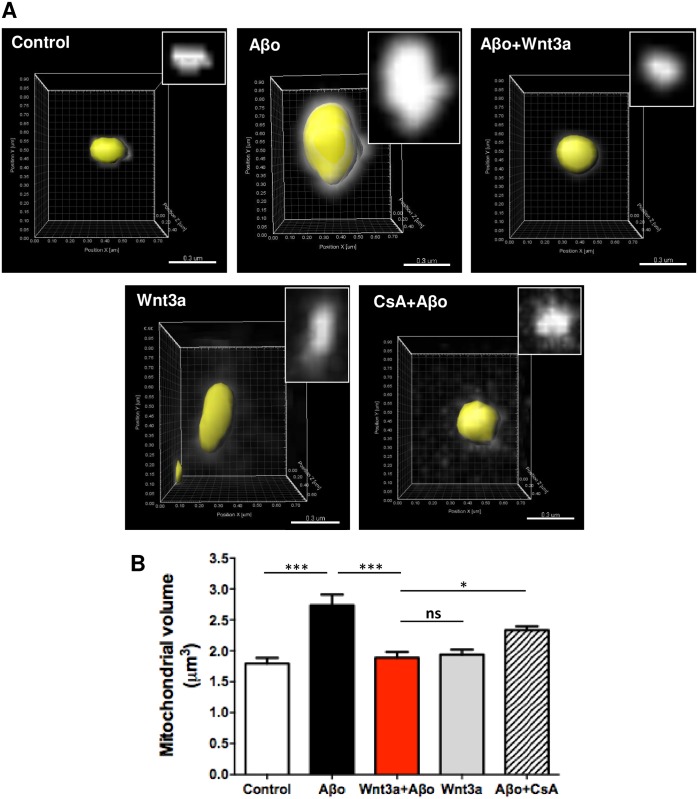
Fig 4. Mitochondrial volume variation in response to Aβos and Wnt3a.
Neurons transfected with mito-Cherry at DIV10 were treated for 24 h with 5 μM Aβos and Wnt3a or were pre-treated for 30 min with 20 μM CsA and then exposed to Aβos. Images show individual 3D-reconstructed mitochondria. Scale bar, 0.3 μm. The graph represents the measurement of mitochondrial volume performed with the Imaris software and used for the mitochondrial network reconstruction. The results are shown as the mean of n = 4 independent experiments and the statistical analysis was performed using one-way ANOVA and post hoc Bonferroni correction: *p<0.05, ***p<0.0005.

