
Figure 4. XRCC1 mutation elevates ADP-ribosylation in cells and cerebellum.
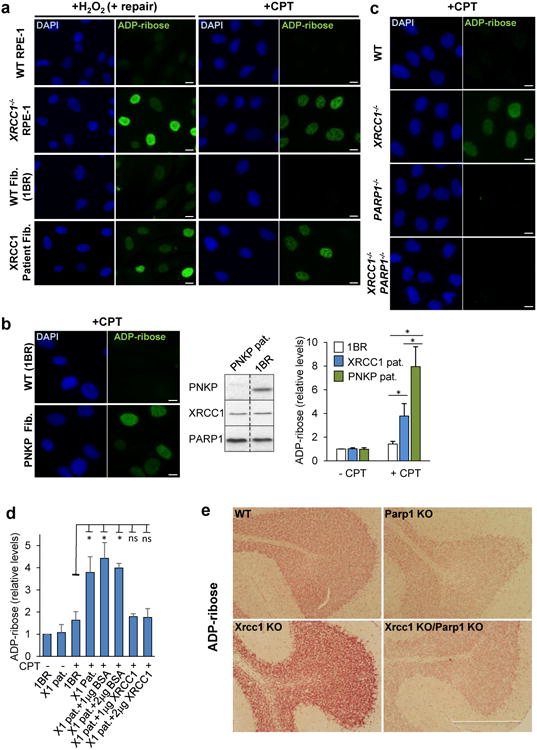
a, ADP-ribosylation in wild type (WT) 1BR fibroblasts, WT RPE-1 cells, XRCC1-patient fibroblasts, and XRCC1-/- RPE-1 cells following H2O2 or CPT treatment. b, Left, ADP-ribosylation levels in 1BR or PNKP patient fibroblasts following CPT treatment. Middle, PNKP, XRCC1, and PARP1 levels in 1BR and PNKP patient fibroblasts. The source data are included in Supplementary Figure 1. Right, ADP-ribose levels quantified by ScanR imaging in 1BR, XRCC1-mutant patient, and PNKP patient fibroblasts before and after CPT treatment. Data are mean (+/-1SD) ADP-ribose levels (relative to untreated 1BR cells) from three independent experiments (>1000 cells/sample). Statistically significant differences (two-tailed t-test) are indicated (*p<0.05). c, ADP-ribosylation levels in the indicated RPE-1 cells following CPT treatment. d, ADP-ribosylation levels quantified by ScanR imaging before and after CPT treatment in 1BR and XRCC1 patient fibroblasts (“X1 pat.”) with or without transfection with 1 μg or 2 μg of BSA or recombinant human XRCC1 protein. Statistical analyses as above. Representative ScanR images are in Extended Data Figure 8. e, ADP-ribosylation levels measured by immunohistochemistry in cerebellar sections from WT mice or mice deleted (“KO”) of Xrcc1 and/or Parp1. Scale bars in IF images are 10 μm and in histology images are 1 mm.