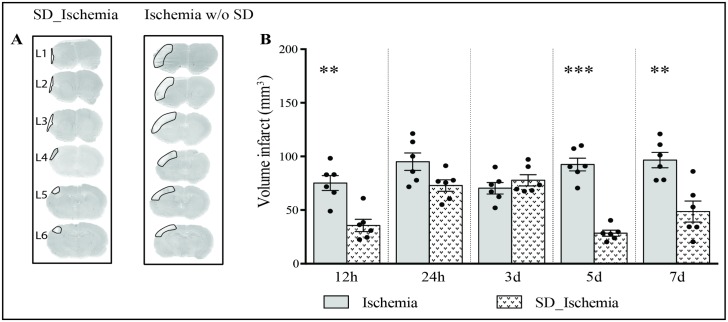
Fig 2. Effects of sleep deprivation (SD) pre-ischemia on the infarct volume.
Lesion volumes corrected for edema were calculated by cresyl violet staining at 12 and 24 hours and 3, 5 and 7 days after ischemic surgery are displayed on the x-axis (see S2 Fig for infarct volume assessed without edema correction and S1 and S2 Tables for data set). (A) Representative sets of brain sections from a rat subjected to 6h of SD pre-ischemia (left panel), and rats subjected to ischemia without SD (right panel). The infarct areas are delineated by a thin black line. L1 is at 2.7 mm anterior to bregma, and the interval between each level is 1 mm (see methods). (B) Infarct volume (mean ± SEM) assessed at 12 and 24 hours and 3, 5 and 7 days after interventions (n = 6 per group) were analysed by unpaired t-test. Dots represent infarct volume of each animal during each time points. Asterisks (*) indicate a statistical difference between groups, **p ≤ .01; *** p ≤ .001.

