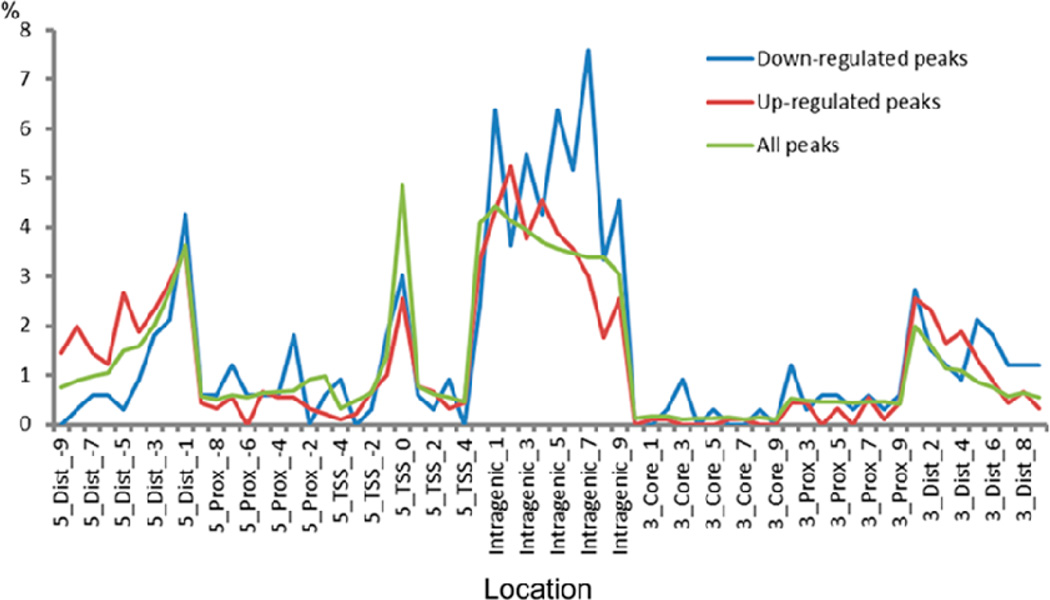
Figure 2.
Location analysis of TCF7L2 binding sites (see online version for colours)
Shown is the percentage of TCF7L2 binding sites in each genomic region (according to hg19 RefSeq gene annotations). The regions are 5’ Distal (5_Dist_xxx as in the x-axis labels), 5’ Proximal (5_Prox_xxx), 5’ TSS (5_TSS_xxx), genebody (Intragenic_xxx), 3’ Core (3_Core_xxx), 3’ Proximal (3_Prox_xxx), and 3’ Distal (3_Dist_xxx).

