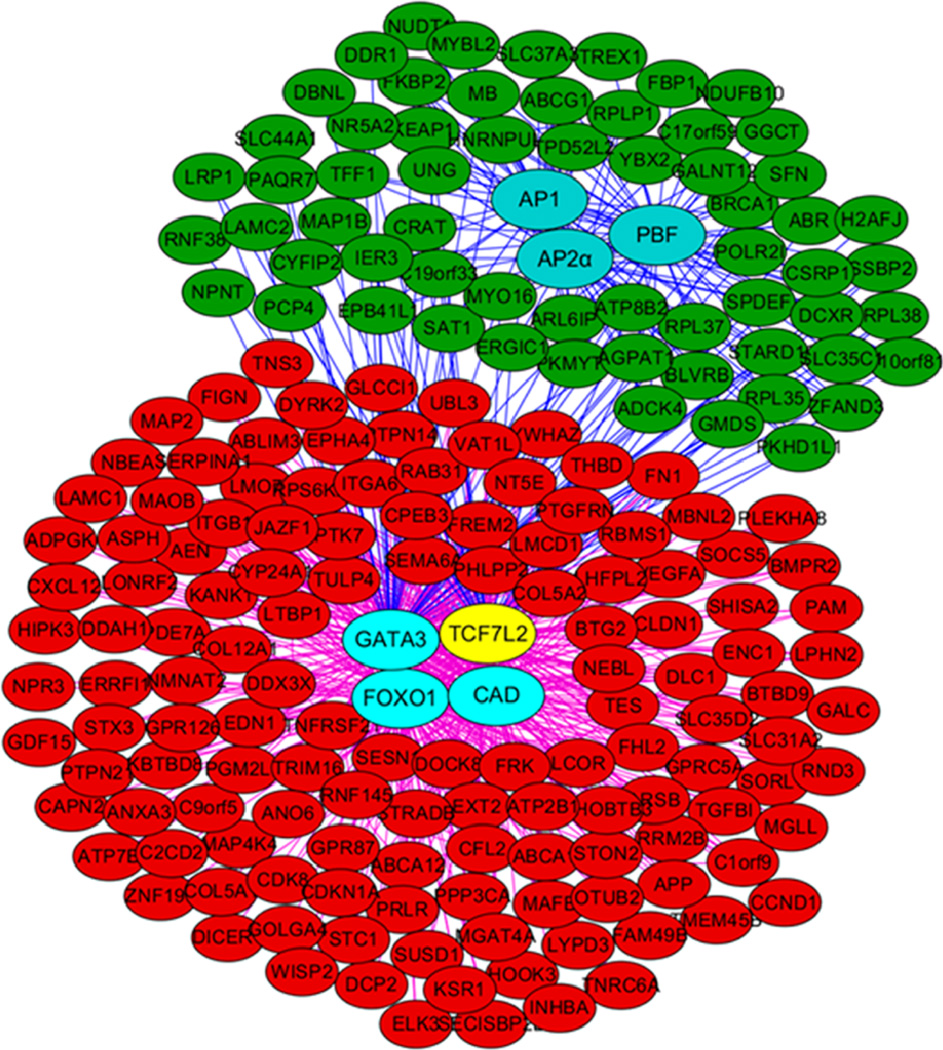
Figure 3.
The regulatory network for TCF7L2 in MCF7 (see online version for colours)
Regulatory networks topologically visualised using Cytoscape. Up-regulated genes and down-regulated genes were indicated by nodes in red and green, respectively. Nodes in cyan represent hub TFs while TCF7L2 is indicated with yellow node. Connections between hub TFs and down-regulated genes were indicated with blue edges and connection between hub TFs and up-regulated genes were indicated with purple edges.

