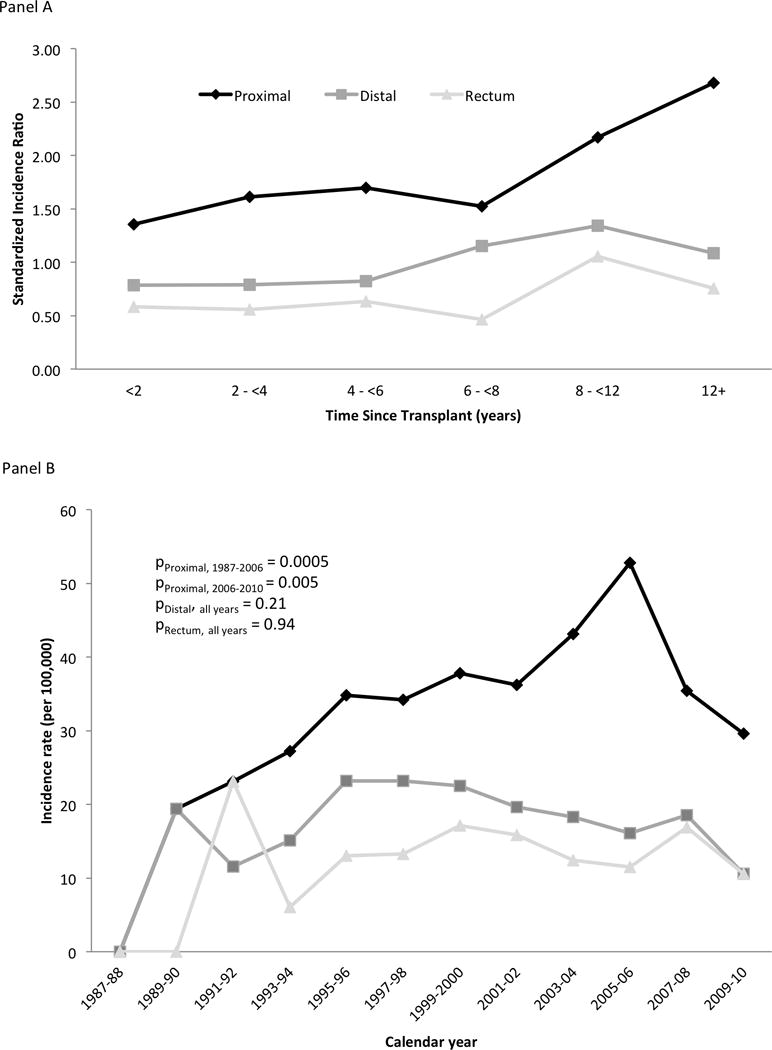
Figure 2. Colorectal cancer risk among transplant recipients according to time since transplantation.

Panel A shows standardized incidence ratios for CRC (y-axis) according to time since transplantation (x-axis). Diamond markers correspond to proximal colon cancer, square markers to distal colon cancer, and triangle markers to rectal cancer. In panel A, the dashed line at a standardized incidence ratio of 1.0 indicates risk similar to the general population.
