
Figure 1.
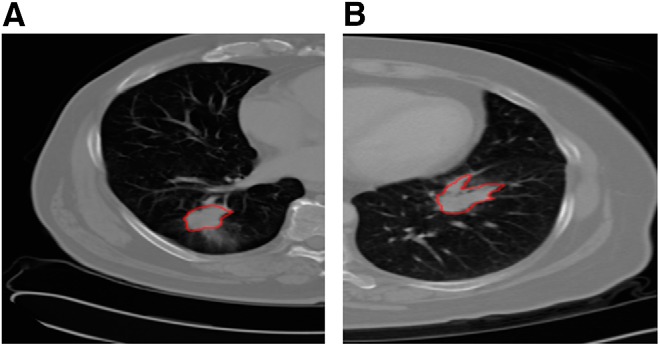
Example computed tomography (CT) slices of long-term (A) and short-term (B) survival groups with tumors outlined.
Official websites use .gov
A
.gov website belongs to an official
government organization in the United States.
Secure .gov websites use HTTPS
A lock (
) or https:// means you've safely
connected to the .gov website. Share sensitive
information only on official, secure websites.
Example computed tomography (CT) slices of long-term (A) and short-term (B) survival groups with tumors outlined.