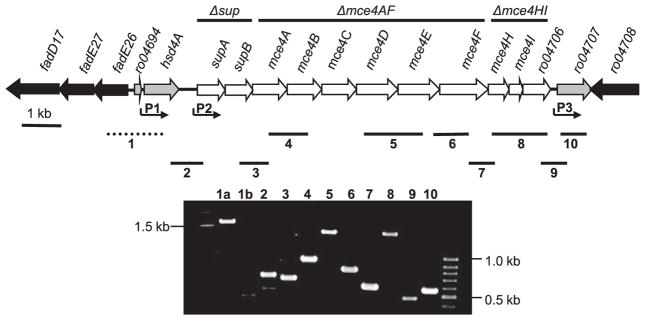
FIGURE 1. The mce4 locus of RHA1.
Three predicted transcriptional promoters are indicated (P1, P2, P3). Numbered solid bars (2–10) indicate transcribed regions detected in RT-PCR assays, and those numbers correspond to the electrophoresis gel lane numbers, showing RT-PCR products. All positive RT-PCR reactions were negative in controls without reverse-transcriptase (not shown). The dashed bar (1) indicates a nontranscribed control, with lane 1a showing the corresponding PCR product from genomic DNA and lane 1b showing the result of the RT-PCR assay. Bars at the top show regions deleted in three mutant strains (Δsup, Δmce4AF, Δmce4HI).

