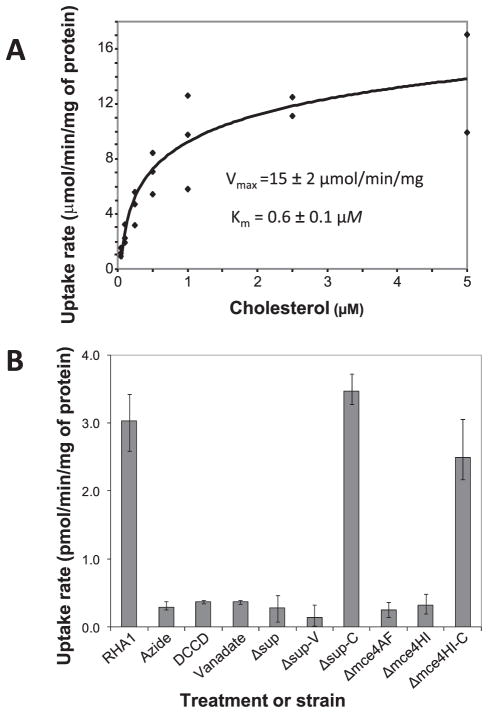
FIGURE 3. Cholesterol uptake by RHA1 and mutant strains.
A, kinetics of uptake by RHA1 (n = three independent experiments using different cultures). The curve represents the fitted Michaelis-Menten equation. B, specific uptake rates of RHA1 and mutants as well as effects of inhibitors (n ≥ three suspensions of cells from independent cultures, except n = two for DCCD treatment, bars indicate range).

