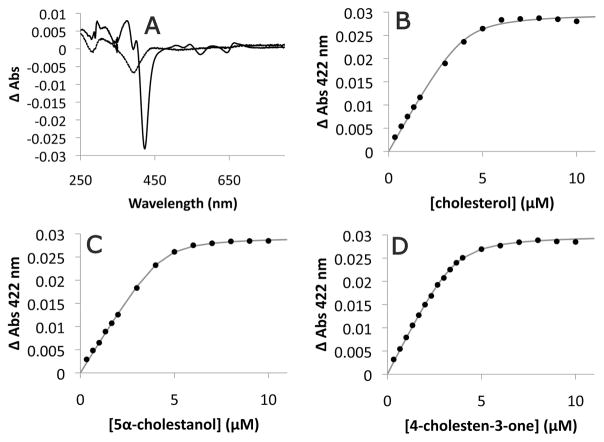
Fig. 5. Binding of steroids to purified CYP125RHA1.
A. Spectral responses of 3.7 μM purified CYP125RHA1 induced by 10 μM cholesterol (solid line) and 10 μM 5-cholestene-26-oic acid-3β-ol (dashed line). The dependence of the absorbance change of CYP125RHA1 at 422 nm on (B) cholesterol, (C) 5α-cholestanol and (D) 4-cholestene-3-one concentration. The best fit of Eq. 1 to the data as determined using R is represented as a grey line with fitted parameters KD = 0.20 ± 0.08 μM, ΔAmax = 0.0298 ± 0.0006, and [E] = 4.0 ± 0.2 μM for cholesterol; KD = 0.15 ± 0.03 μM, ΔAmax = 0.0293 ± 0.0002, and [E] = 4.3 ± 0.1 μM for 5α-cholestanol; and KD = 0.20 ± 0.03 μM, ΔAmax = 0.0300 ± 0.0002, and [E] = 3.6 ± 0.1 μM for 4-cholestene-3-one. Steroids were prepared as stock solutions in 10% 2-hydroxypropyl-β-cyclodextrin which alone did not induce a CYP125RHA1 spectral response.

