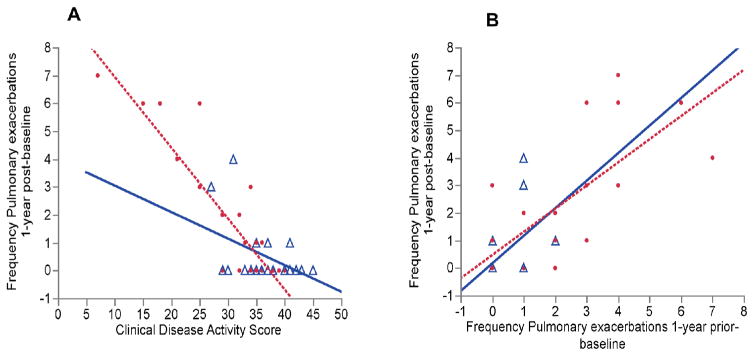
Figure 2.
A) Correlations between FEV1% predicted and the CDAS dichotomized by CRP groups. △ indicates CRP levels <5.2mg/L (r=0.52, p=0.009); ● indicates CRP levels ≥ 5.2 mg/L (r=0.67, p=0.0001). The value p=0.03 indicates significance between regression slopes. B) Correlations between FEV1% predicted and the Health perceptions QOL domain dichotomized by CRP groups. △ indicates CRP levels <5.2 mg/L (r=0.17, p=0.1). ● indicates CRP levels ≥ 5.2 mg/L (r=0.65, p=0.0002). The value p=0.03 indicates significance between regression slopes.

