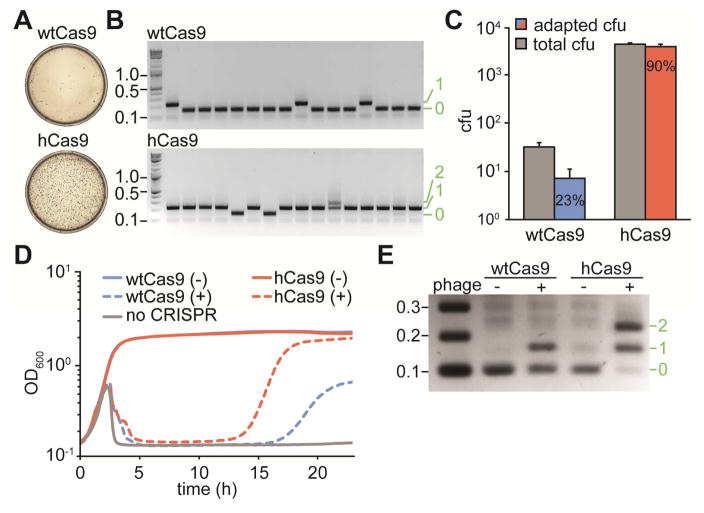
Figure 2. Cas9I473F, or hyper-Cas9 (hCas9) mounts an enhanced CRISPR adaptive immune response.
See also Figure S2.
(A) Representative plates obtained after lytic infection of cells harboring the full CRISPR system of S. pyogenes with wtCas9 or hCas9, showing the number of surviving colonies.
(B) Agarose gel electrophoresis of PCR products of the amplification of the CRISPR of arrays of surviving cells to detect newly acquired spacers (asterisks). Molecular markers (in kb) are indicated in black, number of new spacers added in green.
(C) Quantification of total surviving colonies (gray bars) and surviving colonies with newly incorporated spacers, as detected by PCR (blue and red bars). Data are represented as mean ± SEM of 3 representative biological replicates.
(D) Growth curves of cultures of cells harboring the full CRISPR system of S. pyogenes with wtCas9 or hCas9, with (+) or without (−) phage infection.
(E) PCR-based analysis of the liquid cultures shown in C (at 24 hours post-infection) to check for the acquisition of new spacer sequences in the presence (+) or the absence (−) of phage ϕNM4γ4 infection, by cells expressing wtCas9 or hCas9. Molecular markers (in kb) are indicated in black, number of new spacers added in green. Image is representative of three technical replicates.

