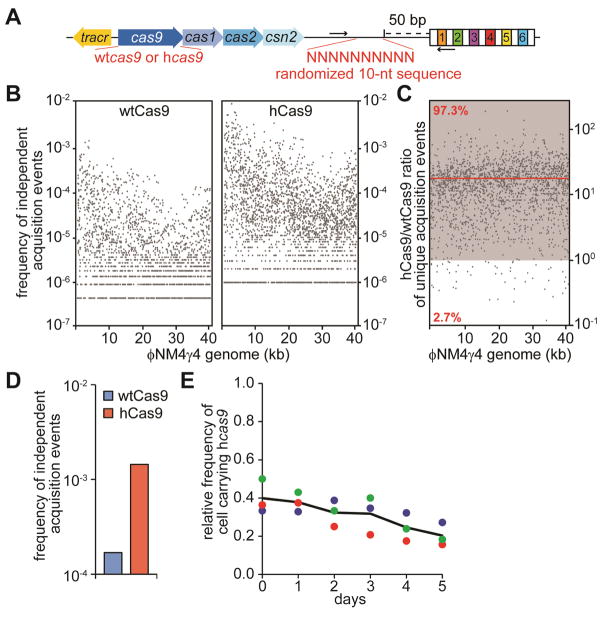
Figure 4. hCas9 promotes higher rates of spacer acquisition.
See also Figure S4.
(A) Schematic diagram of the S. pyogenes CRISPR locus showing the barcode and primers (arrows) used to measure the number of independent spacer acquisition events.
(B) Cultures expressing wtCas9 or hCas9 were infected with ϕNM4γ4 phage, surviving cells were collected after 24 hours, DNA extracted and used as template for PCR of the CRISPR arrays. Amplification products were separated by agarose gel electrophoresis (not shown) and the DNA of the expanded CRISPR array was subject to MiSeq next-generation sequencing. The number of barcodes for each spacer sequence across the phage genome, normalized by the total number of spacer reads obtained, was plotted.
(C) The hCas9/wtCas9 frequency of independent acquisition events ratio for 1938 common spacer sequences was plotted across the phage genome. The zone where the ratio is greater than one is shown in grey. The red line shows the average ratio.
(D) Same as (B) but without phage infection; i.e. a measure of acquisition of spacers derived form the host chromosome and resident plasmids.
(E) Pair-wise competition between staphylococci expressing wtCas9 or hCas9. The change in the relative frequency of cells carrying the hcas9 allele (y-axis) is plotted against the number of culture transfers (one transfer per day, x-axis).

