Fig. 4.
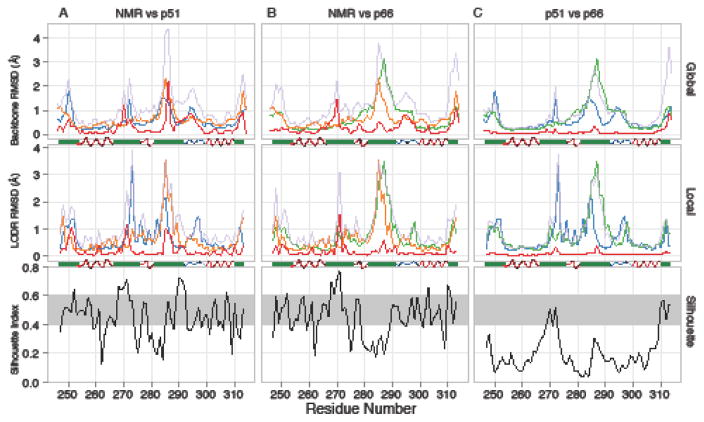
Comparison between the NMR ensemble and the collection of 28 p51 and p66 thumb domain crystal structures. a NMR vs. p51. b NMR vs. p66. c p51vs. p66. For each pair of groups, global (upper panels), and local (middle panels) comparisons are shown, along with a Silhouette Index (lower panels; black trace) plot that identifies the regions with significant differences (above the grey strip) and similarities (below the grey strip). In the global and local comparison plots, the colors are as follows: NMR average backbone intra-group pairwise RMSD (orange), p51 average backbone intra-group pairwise RMSD (blue), and p66 average backbone intra-group pairwise RMSD (green) are shown along with average backbone inter-group pairwise RMSDs (pale purple) and closest approach distances (red). A secondary structure diagram (based on PDB entry 1RTJ) indicates α-helical (red), PII-helical (blue), and other (green) segments.

