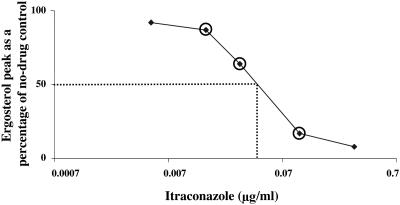
FIG. 4.
Dose-response curve for ergosterol inhibition in C. albicans C288 by ITZ. The relative amount of ergosterol in the sterol fraction under each treatment condition (calculated as described in Materials and Methods) is plotted versus drug concentration. Subsequent egosterol IC50 determinations (the amount of drug resulting in a 50% reduction in ergosterol; indicated by the dashed lines) were performed with drug concentrations that encompassed the linear portion of the inhibition curve (circled data points).

