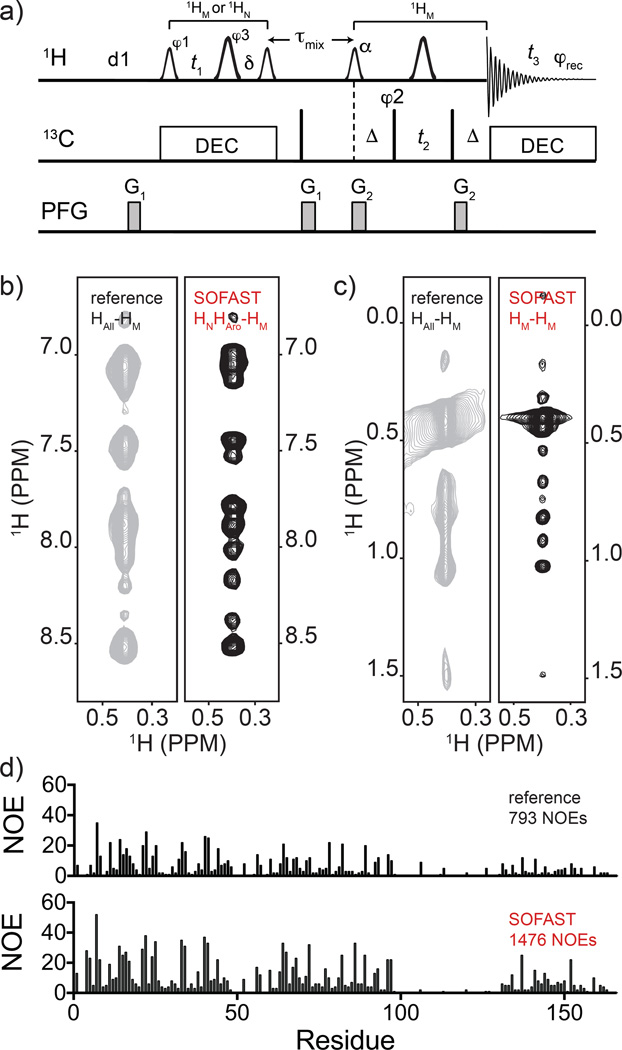
Fig. 4.
Panel a): pulse sequence of 13C-edited 3D SFNOESY-HMQC for frequency labeling HM(F1)-CM(F2)HM(F3) or HN,Aro-CMHM (with addition of two 15N 180° hard pulses at the t1 and δ midpoint). The smaller and larger 1H shaped pulses are 1.69 ms long 90° PC9_4_90 and 1.15 ms long 180° REBURP, respectively. The flip angle (α) of the shaped pulse after τmix should be optimized as discussed in maintext. The first and second vertical arrows indicate the 1H carrier frequency setting to 0.9 ppm for CM(F2)HM(F3) (8.5 ppm for HN,Aro-CMHM) and 4.7 ppm, respectively. The offsets of 1H shaped pulses before and after τmix are 0 Hz (at 4.7 ppm) and −3,230 Hz (at 0.9 ppm), respectively. Please note that two refocusing 15N 180° hard pulses at the midpoint of t1 and δ should be added for HN,Aro-CMHM. The spectral centers of 1H(F1), 13C(F2), 1H(F3) dimensions are at 1.0, (8.5 for HN,Aro-CMHM), 16.5, and 4.7 ppm, respectively. The delays are: d1 = 200 ms, δ = t1(0) + 2×pwN (initial t1 value and 15N 180° pulse width), Δ = 4.0 ms, τmix = 300 ms. The phase cycling are: φ1 = (x, −x), φ2 = (x, −x, −x, x), φ3 = 4(x), 4(y), φrec = (x, −x, −x, x, −x, x,×−x). Bruker decoupling scheme bi_garp_2pl is used. The quadrature detections in t1 and t2 dimensions are acquired via States-TPPI of φ1 and φ2, respectively. The durations and strengths of the gradients are G1 = (1 ms, 15 G/cm), G2 = (1 ms, 5 G/cm). Comparisons of 13C-resolved 3D NOESY-HMQC with 13C-resolved SFNOESY-HMQC counterpart are shown in b) and c) left and right strips, respectively. Experiments were run on 15N-methyl-aromatic labeled FliT-FliJ sample and processed in an identical manner. In the reference spectrum the full 11ppm indirect 1H dimension is sampled (HAll) while in the SOFAST sequence the acquisition is split into two 3Ds, one centered on the indirect-detected amide/aromatic (HNHAro) (b), and one on the methyl (HM) 1H chemical shift (c). Note that the same 3D-NOESY-HMQC strip marked as ‘reference’ is split into two halves for side-by-side comparison. In (d) the number of NOE per residue (and totals) resulting from CYANA automated NOESY assignment protocol for the FliT-FliJ protein are shown for the ‘reference’ (upper) and SOFAST datasets (lower).

