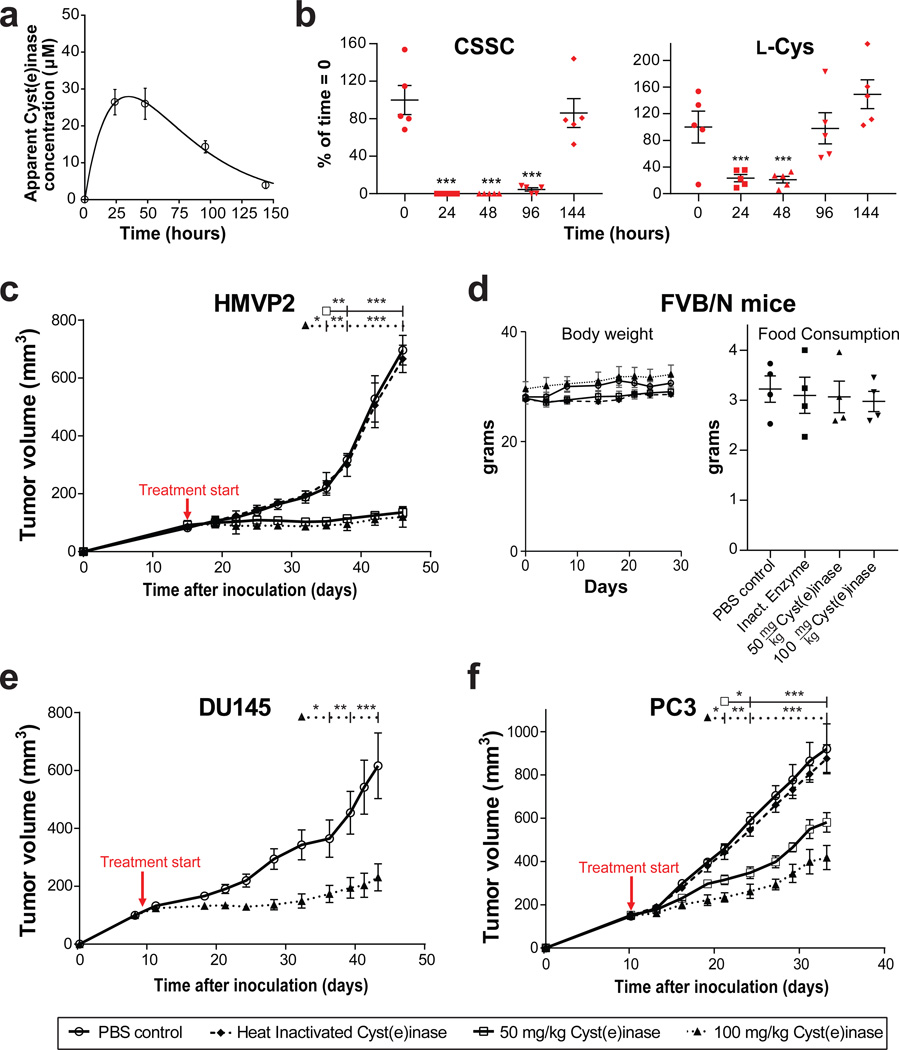
Figure 3. Pharmacokinetics, pharmacodynamics and efficacy of Cyst(e)inase administration in mice.
(a,b) Following single dose Cyst(e)inase administration at 50 mg/kg in FVB mice, (a) apparent Cyst(e)inase concentration in serum as measured by dot blot assay; and (b) relative concentrations of l-Cys and CSSC as assessed by MS as a function of time (n = 5 per group). * P<0.05; ** P<0.01; *** P<0.001; two-sided Student’s t-test. (c–d) Following treatment with active Cyst(e)inase or controls in male FVB/N mice bearing allograft tumors of HMVP2 PCa spheroids; (c) quantification of tumor volume; and (d) average body weight and food consumption per mouse per day for each treatment group. (PBS, n = 5; heat inactivated Cyst(e)inase, n = 6; 50 mg/kg Cyst(e)inase, n = 7; 100 mg/kg Cyst(e)inase, n = 7). (e–f) Following treatment with active Cyst(e)inase or controls, quantification of tumor volume in male nude mice bearing xenograft tumors of (e) DU145 PCa cells (n = 8 per group); and (f) PC3 PCa cells (n = 7 per group). For all studies dosing was terminated when control tumors reached an endpoint. For c, e, f *P<0.05; **P<0.001; *** P<0.0001; repeated measures two-way ANOVA followed by Bonferroni’s multiple comparison test; all data are expressed as mean ± s.e.m.

