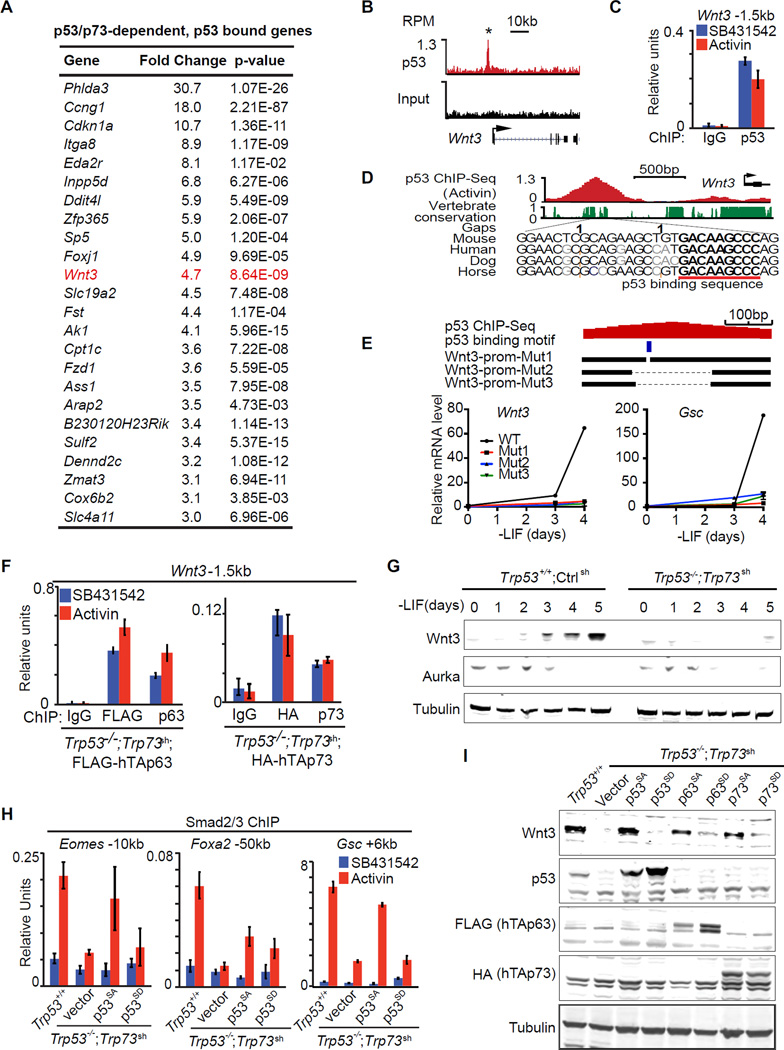
Figure 6. The p53 family controls Wnt3 expression.
A. Table representing the top 24 genes that were differentially expressed (fold change >3, p<0.05, mean normalized read counts > 100) in response to p53/p73-depletion by RNA-Seq, and exhibited significant p53-binding with 50kb from TSS. Genes are ranked by their fold change in RNA-Seq analysis.
B. Gene track view for p53 ChIP-Seq data or input control at the Wnt3 locus. RefSeq gene bodies are schematically represented at the bottom of each track set.
C. Analysis of p53 binding (ChIP-qPCR) to the Wnt3 −1.5kb element in d3 EBs treated with SB or AC for 2 h. ChIP with non-specific IgG was used as negative control.
D. Evolutionary conservation score plot for the p53-binding region near the Wnt3 promoter, and DNA sequence alignment of the peak center in multiple species highlighting the p53 consensus binding sequence.
E. Scheme of CRISPR/Cas9-mediated mutagenesis of the Wnt3 promoter region. Bottom black horizontal bars represent the remaining genomic regions in mutant (Mut1–3) clones whereas the thin lines indicate deleted regions. The p53-binding motif is indicated as a blue box. qRT-PCR analysis of Wnt3 and Gsc upon LIF removal are shown below.
F. ChIP-qPCR analysis of exogenous FLAG-hTAp63 and HA-hTAp73 binding at Wnt3 −1.5kb enhancer region in Trp53−/−;Trp73sh day 4 EB treated with SB or AC for 2 h. Antibodies that recognizes FLAG, HA tags, or specifically human TAp63 and TAp73 were used for ChIP. Non-specific IgG were used as negative control.
G. Western immunoblot analysis of Wnt3 expression in EBs derived from Trp53+/+;Ctrlsh and Trp53−/−;Trp73sh ES cells at indicated time points. Tubulin was used as loading control.
H. Analysis of Smad2/3 binding (ChIP-qPCR) to the Gsc +6kb enhancer in d3 EBs from Trp53+/+;Ctrlsh or Trp53−/−;Trp73sh ES cells transduced with p53SA or p53SD, followed by 2h SB or AC treatment.
I. Western immunoblot analysis of Wnt3 and p53 family protein levels in EBs from control ES cells (Trp53+/+;Ctrlsh), or p53/p73-depleted cells (Trp53−/−;Trp73sh), or p53/p73-depleted cells expressing empty vector or Aurka-resistant (p53SA, p63SA, p73SA) or Aurka phosphorylation mimic (p53SD, p63SD, p73SD) mutant forms of p53 family members. Tubulin was used as loading control.
See also Figure S6.

